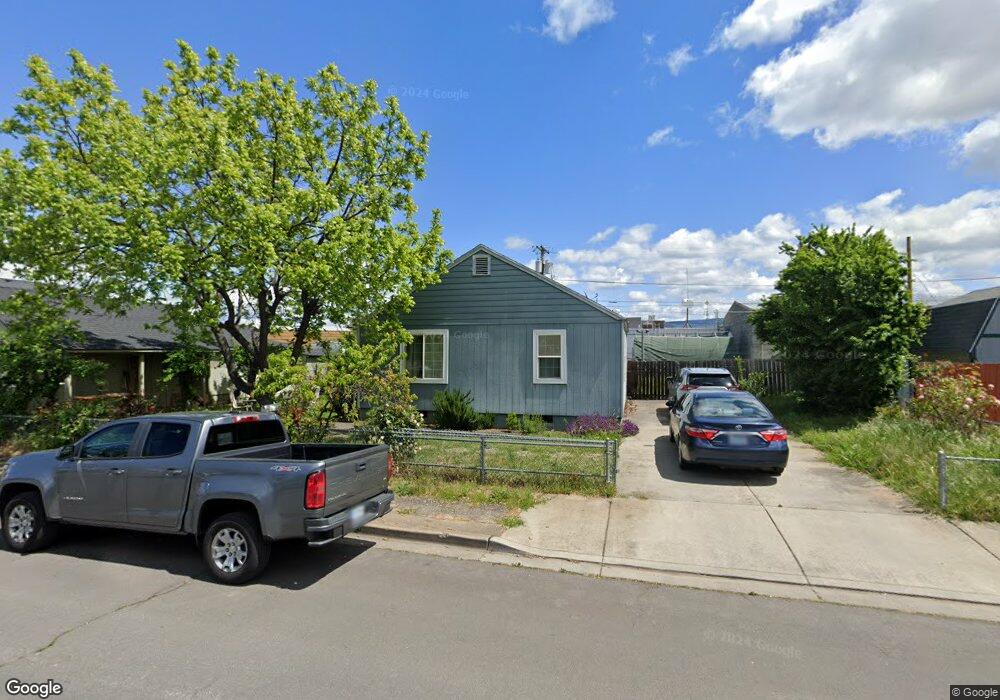
816 Cedar St Medford, OR 97501
Liberty Park NeighborhoodEstimated Value: $226,000 - $249,000
2
Beds
1
Bath
896
Sq Ft
$264/Sq Ft
Est. Value
About This Home
This home is located at 816 Cedar St, Medford, OR 97501 and is currently estimated at $236,795, approximately $264 per square foot. 816 Cedar St is a home located in Jackson County with nearby schools including Jackson Elementary School, McLoughlin Middle School, and North Medford High School.
Ownership History
Date
Name
Owned For
Owner Type
Purchase Details
Closed on
Oct 6, 2020
Sold by
Delopez Maria De Jesus Serna and Estate Of Francisco Leonel Lop
Bought by
Lopez Francisco Leonel and Delopez Maria De
Current Estimated Value
Purchase Details
Closed on
Aug 24, 2005
Sold by
Lopez Francisco and Lopez Maria
Bought by
Lopez Francisco
Home Financials for this Owner
Home Financials are based on the most recent Mortgage that was taken out on this home.
Original Mortgage
$138,750
Interest Rate
5.61%
Mortgage Type
New Conventional
Create a Home Valuation Report for This Property
The Home Valuation Report is an in-depth analysis detailing your home's value as well as a comparison with similar homes in the area
Home Values in the Area
Average Home Value in this Area
Purchase History
| Date | Buyer | Sale Price | Title Company |
|---|---|---|---|
| Lopez Francisco Leonel | -- | None Listed On Document | |
| Lopez Francisco | -- | Lawyers Title Insurance Corp |
Source: Public Records
Mortgage History
| Date | Status | Borrower | Loan Amount |
|---|---|---|---|
| Previous Owner | Lopez Francisco | $138,750 |
Source: Public Records
Tax History Compared to Growth
Tax History
| Year | Tax Paid | Tax Assessment Tax Assessment Total Assessment is a certain percentage of the fair market value that is determined by local assessors to be the total taxable value of land and additions on the property. | Land | Improvement |
|---|---|---|---|---|
| 2025 | $1,493 | $102,970 | $51,480 | $51,490 |
| 2024 | $1,493 | $99,980 | $49,990 | $49,990 |
| 2023 | $1,448 | $97,070 | $48,540 | $48,530 |
| 2022 | $1,412 | $97,070 | $48,540 | $48,530 |
| 2021 | $1,376 | $94,250 | $47,130 | $47,120 |
| 2020 | $1,347 | $91,510 | $45,760 | $45,750 |
| 2019 | $1,315 | $86,270 | $43,140 | $43,130 |
| 2018 | $1,282 | $83,760 | $41,890 | $41,870 |
| 2017 | $1,259 | $83,760 | $41,890 | $41,870 |
| 2016 | $1,267 | $78,970 | $39,500 | $39,470 |
| 2015 | $1,218 | $78,970 | $39,500 | $39,470 |
| 2014 | $1,196 | $74,440 | $37,240 | $37,200 |
Source: Public Records
Map
Nearby Homes