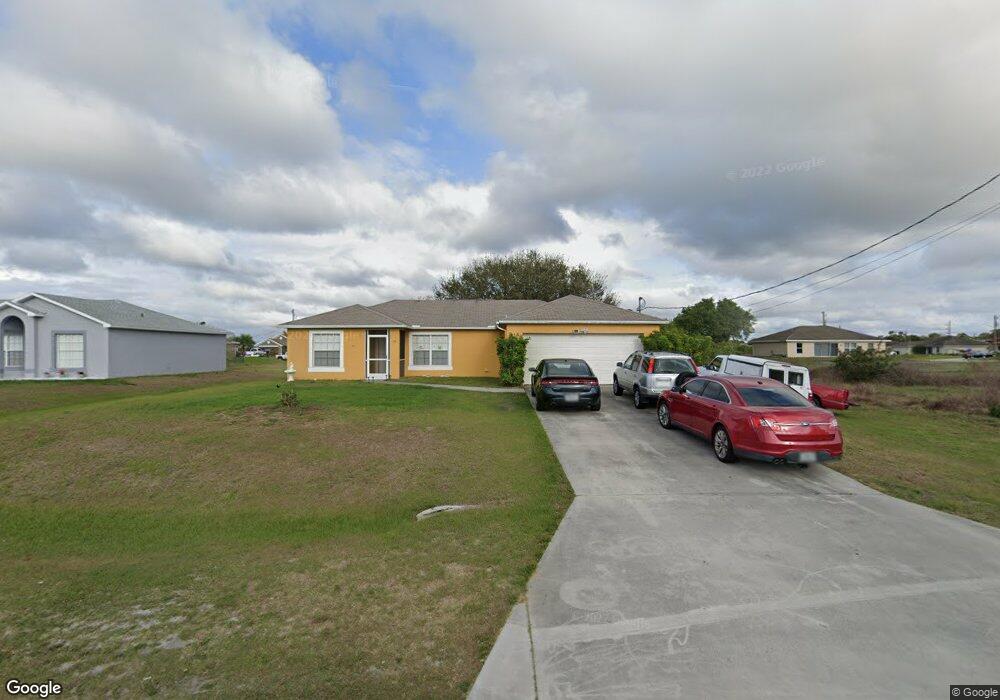
816 Chaplin Ave Unit 15 Lehigh Acres, FL 33971
Centennial NeighborhoodEstimated Value: $235,000 - $314,000
3
Beds
2
Baths
1,535
Sq Ft
$179/Sq Ft
Est. Value
About This Home
This home is located at 816 Chaplin Ave Unit 15, Lehigh Acres, FL 33971 and is currently estimated at $274,044, approximately $178 per square foot. 816 Chaplin Ave Unit 15 is a home located in Lee County with nearby schools including Gateway Elementary School, Lehigh Elementary School, and Tice Elementary School.
Ownership History
Date
Name
Owned For
Owner Type
Purchase Details
Closed on
Mar 12, 2014
Sold by
Shapiro Marc L
Bought by
West Coast Island Llc and 816 Chaplin Ave Trust
Current Estimated Value
Purchase Details
Closed on
Aug 29, 2013
Sold by
Fleitas Jorge and Fleitas Osvilda
Bought by
816 Chaplin Ave Trust
Purchase Details
Closed on
Dec 13, 2011
Sold by
Bank Of America Na
Bought by
Fleitas Jorge and Fleitas Osvilda
Purchase Details
Closed on
Jul 26, 2011
Sold by
Martinez Albert
Bought by
Bank Of America
Purchase Details
Closed on
Feb 11, 2004
Sold by
Holiday Builders Inc
Bought by
Martinez Albert and Martinez Sylvia
Home Financials for this Owner
Home Financials are based on the most recent Mortgage that was taken out on this home.
Original Mortgage
$123,500
Interest Rate
7.7%
Mortgage Type
Unknown
Purchase Details
Closed on
Apr 29, 2003
Sold by
Carroll Dick J and Carroll Chalmers E
Bought by
Holiday Bldr Inc
Create a Home Valuation Report for This Property
The Home Valuation Report is an in-depth analysis detailing your home's value as well as a comparison with similar homes in the area
Home Values in the Area
Average Home Value in this Area
Purchase History
| Date | Buyer | Sale Price | Title Company |
|---|---|---|---|
| West Coast Island Llc | -- | Attorney | |
| 816 Chaplin Ave Trust | -- | Attorney | |
| Fleitas Jorge | $65,200 | Attorney | |
| Bank Of America | $35,200 | None Available | |
| Martinez Albert | $123,500 | Lawyers Title Ins | |
| Holiday Bldr Inc | $4,000 | -- |
Source: Public Records
Mortgage History
| Date | Status | Borrower | Loan Amount |
|---|---|---|---|
| Previous Owner | Martinez Albert | $123,500 |
Source: Public Records
Tax History
| Year | Tax Paid | Tax Assessment Tax Assessment Total Assessment is a certain percentage of the fair market value that is determined by local assessors to be the total taxable value of land and additions on the property. | Land | Improvement |
|---|---|---|---|---|
| 2025 | $3,305 | $188,307 | $26,648 | $161,659 |
| 2024 | $2,777 | $192,944 | -- | -- |
| 2023 | $3,144 | $175,404 | $0 | $0 |
| 2022 | $2,777 | $159,458 | $0 | $0 |
| 2021 | $2,381 | $144,962 | $11,000 | $133,962 |
| 2020 | $2,313 | $135,665 | $9,000 | $126,665 |
| 2019 | $2,312 | $135,660 | $7,000 | $128,660 |
Source: Public Records
Map
Nearby Homes
- 821 Casino Ave
- 5007 Barth St
- 5201 Brookfield St
- 817 Atherton Ave
- 4909 Berryman St
- 909 Adeline Ave
- 5000 Bygone St
- 5002 Bygone St
- 5312 Bygone St
- 5004 Bygone St
- 4907 Berryman St
- 820 Acton Ave
- 4915 Bywood St
- 607 Leo Ave N
- 5005 Bywood St
- 5106 Lee Cir S
- 5014 Lee Blvd
- 4914 7th St W
- 4911 Bywood St
- 4906 Brookfield St
- 818 Chaplin Ave
- 817 Chapel Ave Unit 15
- 815 Chapel Ave
- 812 Chaplin Ave
- 813 Chaplin Ave
- 815 Chaplin Ave
- 821 Chapel Ave Unit 15
- 813 Chapel Ave
- 811 Chaplin Ave
- 822 Chaplin Ave
- 812 Chapel Ave
- 816 Chapel Ave
- 814 Chapel Ave
- 818 Chapel Ave
- 820 Chapel Ave Unit 15
- 816 Adeline Ave
- 814 Adeline Ave
- 818 Adeline Ave
- 5017 Berryman St
- 812 Adeline Ave
Your Personal Tour Guide
Ask me questions while you tour the home.