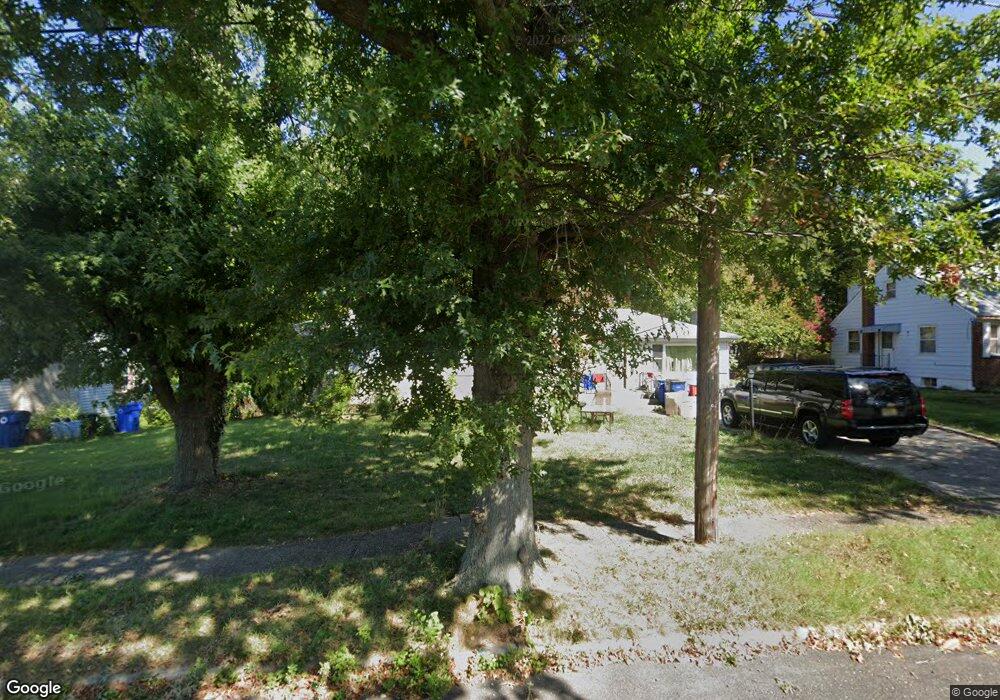
816 Chestnut Ave Laurel Springs, NJ 08021
Estimated Value: $294,000 - $337,000
--
Bed
--
Bath
1,395
Sq Ft
$232/Sq Ft
Est. Value
About This Home
This home is located at 816 Chestnut Ave, Laurel Springs, NJ 08021 and is currently estimated at $323,921, approximately $232 per square foot. 816 Chestnut Ave is a home located in Camden County with nearby schools including Laurel Springs School, Saint John Paul II Regional School, and South Jersey Sudbury School.
Ownership History
Date
Name
Owned For
Owner Type
Purchase Details
Closed on
Sep 16, 2005
Sold by
Dicristino Betsy
Bought by
Martin Jason A and Martin Patricia A
Current Estimated Value
Home Financials for this Owner
Home Financials are based on the most recent Mortgage that was taken out on this home.
Original Mortgage
$155,900
Outstanding Balance
$83,040
Interest Rate
5.78%
Estimated Equity
$240,881
Purchase Details
Closed on
Feb 26, 2004
Sold by
Bubser Kenneth D
Bought by
Cristino Betsy Di
Home Financials for this Owner
Home Financials are based on the most recent Mortgage that was taken out on this home.
Original Mortgage
$124,000
Interest Rate
5.71%
Purchase Details
Closed on
Feb 5, 2002
Sold by
Morgan Dolores T
Bought by
Bubser Kenneth D and Lewis Suzanne R
Home Financials for this Owner
Home Financials are based on the most recent Mortgage that was taken out on this home.
Original Mortgage
$109,725
Interest Rate
7.18%
Create a Home Valuation Report for This Property
The Home Valuation Report is an in-depth analysis detailing your home's value as well as a comparison with similar homes in the area
Home Values in the Area
Average Home Value in this Area
Purchase History
| Date | Buyer | Sale Price | Title Company |
|---|---|---|---|
| Martin Jason A | $194,900 | -- | |
| Cristino Betsy Di | $155,000 | -- | |
| Bubser Kenneth D | $115,500 | -- |
Source: Public Records
Mortgage History
| Date | Status | Borrower | Loan Amount |
|---|---|---|---|
| Open | Martin Jason A | $155,900 | |
| Previous Owner | Cristino Betsy Di | $124,000 | |
| Previous Owner | Bubser Kenneth D | $109,725 |
Source: Public Records
Tax History Compared to Growth
Tax History
| Year | Tax Paid | Tax Assessment Tax Assessment Total Assessment is a certain percentage of the fair market value that is determined by local assessors to be the total taxable value of land and additions on the property. | Land | Improvement |
|---|---|---|---|---|
| 2025 | $8,580 | $154,200 | $38,400 | $115,800 |
| 2024 | $8,314 | $154,200 | $38,400 | $115,800 |
| 2023 | $8,314 | $154,200 | $38,400 | $115,800 |
| 2022 | $8,182 | $154,200 | $38,400 | $115,800 |
| 2021 | $7,771 | $154,200 | $38,400 | $115,800 |
| 2020 | $8,009 | $154,200 | $38,400 | $115,800 |
| 2019 | $8,096 | $154,200 | $38,400 | $115,800 |
| 2018 | $7,861 | $154,200 | $38,400 | $115,800 |
| 2017 | $7,627 | $154,200 | $38,400 | $115,800 |
| 2016 | $7,425 | $98,900 | $31,900 | $67,000 |
| 2015 | $7,254 | $98,900 | $31,900 | $67,000 |
| 2014 | $7,143 | $98,900 | $31,900 | $67,000 |
Source: Public Records
Map
Nearby Homes
- 135 Madison Ave
- 125 Madison Ave
- 316 E Stafford Ave
- 403 N White Horse Pike
- 513 N White Horse Pike
- 514 Park Ave
- 427 W Maple Ave
- 7 Sidney Ln
- 3 Jefferson Ave
- 503 Laurel Rd
- 146 Suburban Terrace
- 104 W Park Ave
- 121 Union Ave
- 116 W Park Ave
- 25 State Ave
- 20a Temple Ave
- 126 E Linden Ave
- 823 N White Horse Pike
- 86 Saratoga Rd
- 26 Station Ave
- 828 Chestnut Ave
- 824 Chestnut Ave
- 832 Chestnut Ave
- 200 Mount Vernon Ave
- 902 Chestnut Ave
- 912 Chestnut Ave
- 808 Chestnut Ave
- 211 Mount Vernon Ave
- 219 Mount Vernon Ave
- 205 Mount Vernon Ave
- 225 Mount Vernon Ave
- 227 Mount Vernon Ave
- 229 Mount Vernon Ave
- 802 Chestnut Ave
- 920 Chestnut Ave
- 233 Mount Vernon Ave
- 135 Mount Vernon Ave
- 315 Virginia Ave
- 235 Trenton Ave
- 932 Chestnut Ave