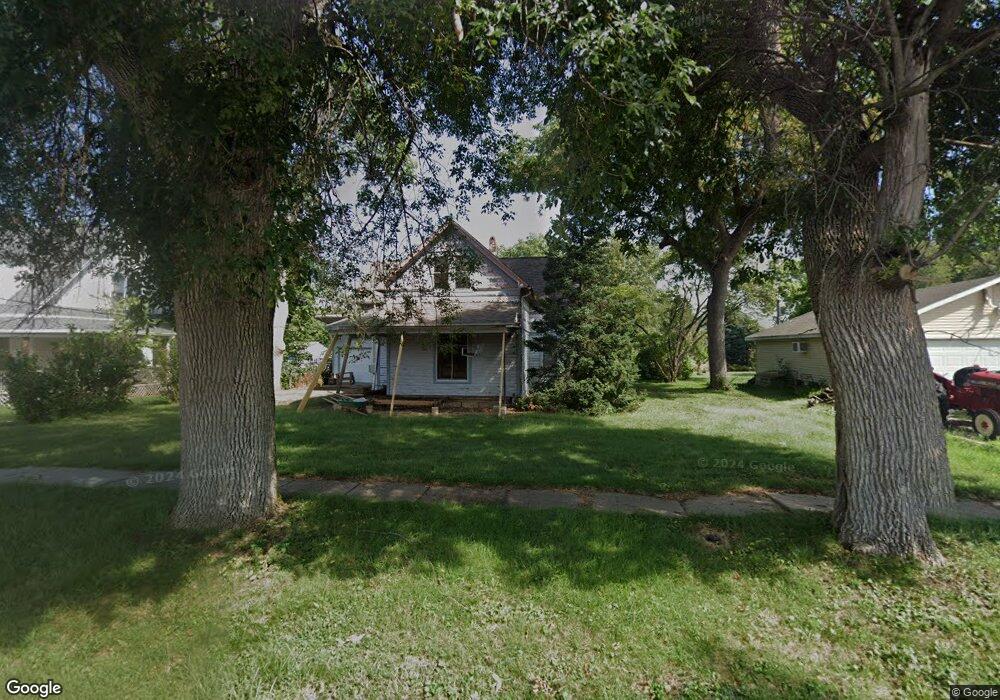
816 E 19th St Falls City, NE 68355
Estimated Value: $90,409 - $134,000
3
Beds
2
Baths
1,064
Sq Ft
$105/Sq Ft
Est. Value
About This Home
This home is located at 816 E 19th St, Falls City, NE 68355 and is currently estimated at $111,852, approximately $105 per square foot. 816 E 19th St is a home located in Richardson County with nearby schools including Falls City North Elementary School, Falls City South Elementary School, and Falls City Middle School.
Ownership History
Date
Name
Owned For
Owner Type
Purchase Details
Closed on
Feb 5, 2008
Sold by
Lauer Todd and Lauer Jacqueline
Bought by
Jones Joyce M
Current Estimated Value
Purchase Details
Closed on
Mar 15, 2006
Sold by
Lauer Todd and Lauer Jacqueline
Bought by
Jones Joyce M
Purchase Details
Closed on
Oct 10, 2005
Sold by
Lauer Todd and Lauer Jacqueline
Bought by
Jones Joyce M
Purchase Details
Closed on
May 29, 2001
Sold by
Schawang Life Est Frank
Bought by
Lauer Todd and Lauer Jacqueline
Create a Home Valuation Report for This Property
The Home Valuation Report is an in-depth analysis detailing your home's value as well as a comparison with similar homes in the area
Home Values in the Area
Average Home Value in this Area
Purchase History
| Date | Buyer | Sale Price | Title Company |
|---|---|---|---|
| Jones Joyce M | -- | -- | |
| Jones Joyce M | $43,750 | -- | |
| Jones Joyce M | -- | -- | |
| Lauer Todd | $35,000 | -- |
Source: Public Records
Tax History Compared to Growth
Tax History
| Year | Tax Paid | Tax Assessment Tax Assessment Total Assessment is a certain percentage of the fair market value that is determined by local assessors to be the total taxable value of land and additions on the property. | Land | Improvement |
|---|---|---|---|---|
| 2025 | $726 | $64,799 | $3,600 | $61,199 |
| 2024 | $726 | $61,335 | $3,600 | $57,735 |
| 2023 | $1,046 | $63,782 | $3,600 | $60,182 |
| 2022 | $1,146 | $59,690 | $1,620 | $58,070 |
| 2021 | $1,071 | $57,165 | $1,620 | $55,545 |
| 2020 | $1,033 | $54,520 | $1,620 | $52,900 |
| 2019 | $1,019 | $52,979 | $1,620 | $51,359 |
| 2018 | $1,000 | $51,483 | $1,620 | $49,863 |
| 2017 | $1,002 | $51,483 | $1,620 | $49,863 |
| 2016 | $969 | $50,031 | $1,620 | $48,411 |
| 2015 | $972 | $50,031 | $1,620 | $48,411 |
| 2014 | $971 | $50,031 | $1,620 | $48,411 |
Source: Public Records
Map
Nearby Homes