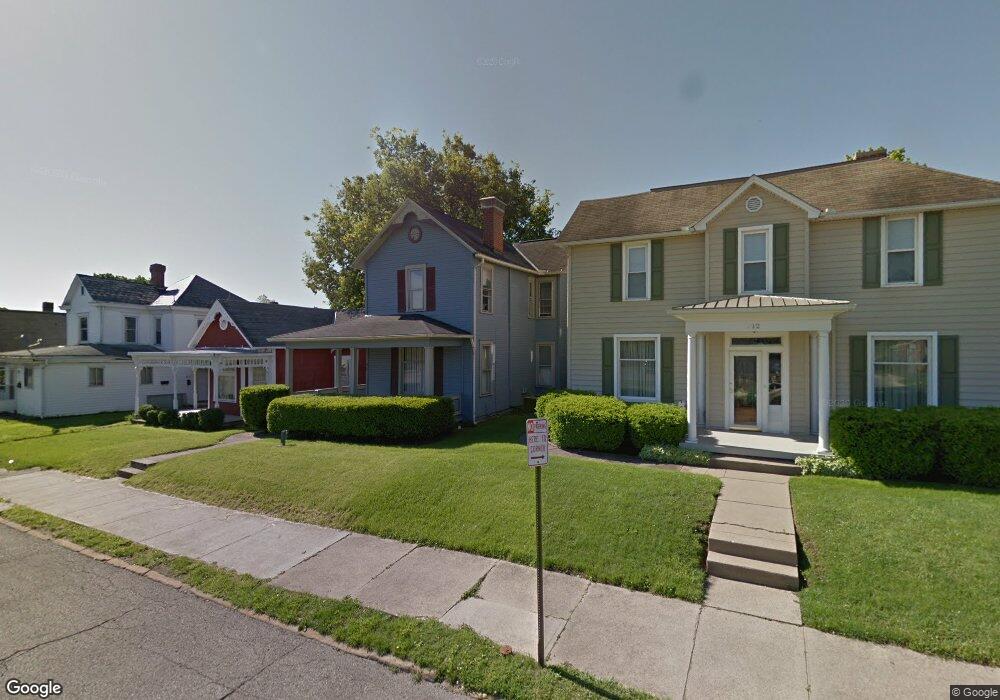
816 E Main St Lancaster, OH 43130
Estimated Value: $167,344 - $195,000
2
Beds
2
Baths
1,600
Sq Ft
$113/Sq Ft
Est. Value
About This Home
This home is located at 816 E Main St, Lancaster, OH 43130 and is currently estimated at $180,586, approximately $112 per square foot. 816 E Main St is a home located in Fairfield County with nearby schools including Thomas Ewing Junior High School, Lancaster High School, and St Mary Elementary School.
Ownership History
Date
Name
Owned For
Owner Type
Purchase Details
Closed on
Dec 13, 2018
Sold by
Varney Suzanne and Varney Mark Bibler
Bought by
Lhg Holdings Llc
Current Estimated Value
Purchase Details
Closed on
Aug 16, 1995
Sold by
Jackson Lindel R
Bought by
Glaab Lawrence H and Glaab Sue Glaab G
Home Financials for this Owner
Home Financials are based on the most recent Mortgage that was taken out on this home.
Original Mortgage
$48,800
Interest Rate
7.64%
Mortgage Type
Commercial
Purchase Details
Closed on
Mar 1, 1987
Create a Home Valuation Report for This Property
The Home Valuation Report is an in-depth analysis detailing your home's value as well as a comparison with similar homes in the area
Home Values in the Area
Average Home Value in this Area
Purchase History
| Date | Buyer | Sale Price | Title Company |
|---|---|---|---|
| Lhg Holdings Llc | -- | None Available | |
| Glaab Lawrence H | $61,000 | -- | |
| -- | $39,000 | -- |
Source: Public Records
Mortgage History
| Date | Status | Borrower | Loan Amount |
|---|---|---|---|
| Previous Owner | Glaab Lawrence H | $48,800 |
Source: Public Records
Tax History
| Year | Tax Paid | Tax Assessment Tax Assessment Total Assessment is a certain percentage of the fair market value that is determined by local assessors to be the total taxable value of land and additions on the property. | Land | Improvement |
|---|---|---|---|---|
| 2025 | $3,026 | $44,180 | $18,330 | $25,850 |
| 2024 | $3,026 | $33,660 | $8,330 | $25,330 |
| 2023 | $1,251 | $33,660 | $8,330 | $25,330 |
| 2022 | $1,258 | $33,660 | $8,330 | $25,330 |
| 2021 | $1,101 | $27,600 | $8,330 | $19,270 |
| 2020 | $1,056 | $27,600 | $8,330 | $19,270 |
| 2019 | $1,005 | $27,600 | $8,330 | $19,270 |
| 2018 | $913 | $27,700 | $8,330 | $19,370 |
| 2017 | $914 | $23,820 | $8,330 | $15,490 |
| 2016 | $891 | $23,820 | $8,330 | $15,490 |
| 2015 | $892 | $23,140 | $8,330 | $14,810 |
| 2014 | $851 | $23,140 | $8,330 | $14,810 |
| 2013 | $851 | $23,140 | $8,330 | $14,810 |
Source: Public Records
Map
Nearby Homes
- 846 E Main St
- 844 E Wheeling St
- 867 E Wheeling St
- 0 Boyd St Unit 226002693
- 869 E Mulberry St
- 1106 E Walnut St
- 1006 King St
- 619 E Main St
- 621 E Mulberry St
- 641 King St
- 545 E Main St
- 534 E Wheeling St
- 403 S Ewing St
- 736 E Allen St
- 627 Harding Ave
- 632 N Eastwood Ave
- 1408 E Wheeling St
- 627 Sheridan Dr
- 538 E 6th Ave
- 630 Sheridan Dr
- 820 E Main St
- 812 E Main St
- 824 E Main St
- 817 E Chestnut St
- 817 E Chestnut St
- 832 E Main St
- 834 E Main St
- 815 E Chestnut St
- 813 E Chestnut St
- 838 E Main St
- 819 E Chestnut St
- 807 E Chestnut St
- 831 E Chestnut St
- 811 E Chestnut St
- 840 E Main St
- 121 S Cherry St
- 801 E Chestnut St
- 805 E Chestnut St
- 125 S Cherry St
- 807 E Main St