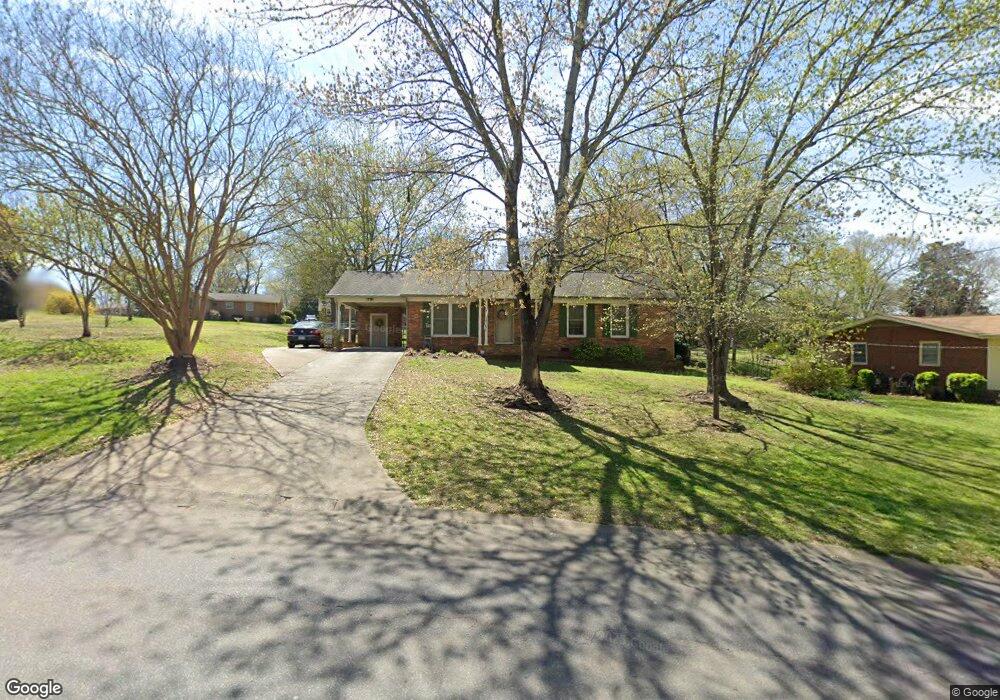
816 E Main St Shelby, NC 28150
Estimated Value: $129,000 - $238,000
Studio
--
Bath
1,305
Sq Ft
$135/Sq Ft
Est. Value
About This Home
This home is located at 816 E Main St, Shelby, NC 28150 and is currently estimated at $176,233, approximately $135 per square foot. 816 E Main St is a home located in Cleveland County with nearby schools including Shelby Middle School, Shelby High School, and Pinnacle Classical Academy.
Ownership History
Date
Name
Owned For
Owner Type
Purchase Details
Closed on
Sep 21, 2022
Sold by
Sherbert and Trevor
Bought by
Humphries Chad A and Humphries Nicole S
Current Estimated Value
Purchase Details
Closed on
Mar 8, 2021
Sold by
Patton James Joshua
Bought by
Patton Lauren Williams and Williams-Sherbert Lauren
Purchase Details
Closed on
Feb 2, 2021
Sold by
Patton James Joshua
Bought by
Patton Lauren Williams and Williams Sherbert Lauren
Purchase Details
Closed on
Mar 30, 2017
Sold by
Williams Steven Alexander and Williams Jennifer B
Bought by
Patton Lauren Williams and Patton James Joshua
Home Financials for this Owner
Home Financials are based on the most recent Mortgage that was taken out on this home.
Original Mortgage
$85,500
Interest Rate
4.1%
Mortgage Type
New Conventional
Create a Home Valuation Report for This Property
The Home Valuation Report is an in-depth analysis detailing your home's value as well as a comparison with similar homes in the area
Home Values in the Area
Average Home Value in this Area
Purchase History
| Date | Buyer | Sale Price | Title Company |
|---|---|---|---|
| Humphries Chad A | $110,000 | -- | |
| Patton Lauren Williams | -- | None Listed On Document | |
| Patton Lauren Williams | -- | None Available | |
| Patton Lauren Williams | $95,000 | None Available |
Source: Public Records
Mortgage History
| Date | Status | Borrower | Loan Amount |
|---|---|---|---|
| Previous Owner | Patton Lauren Williams | $85,500 |
Source: Public Records
Tax History
| Year | Tax Paid | Tax Assessment Tax Assessment Total Assessment is a certain percentage of the fair market value that is determined by local assessors to be the total taxable value of land and additions on the property. | Land | Improvement |
|---|---|---|---|---|
| 2025 | $1,473 | $147,997 | $16,315 | $131,682 |
| 2024 | $1,265 | $102,921 | $13,596 | $89,325 |
| 2023 | $1,259 | $102,921 | $13,596 | $89,325 |
| 2022 | $1,259 | $102,921 | $13,596 | $89,325 |
| 2021 | $1,265 | $102,921 | $13,596 | $89,325 |
| 2020 | $1,137 | $89,716 | $13,596 | $76,120 |
| 2019 | $1,137 | $89,716 | $13,596 | $76,120 |
| 2018 | $1,136 | $89,716 | $13,596 | $76,120 |
| 2017 | $1,107 | $89,716 | $13,596 | $76,120 |
| 2016 | $1,111 | $89,716 | $13,596 | $76,120 |
| 2015 | $1,070 | $91,029 | $10,151 | $80,878 |
| 2014 | $1,070 | $91,029 | $10,151 | $80,878 |
Source: Public Records
Map
Nearby Homes
- 828 E Main St
- 828 Cabaniss Dr
- 830 Cabaniss Dr
- 1544 Kings Rd
- 1521 Kings Rd
- 1609 E Dixon Blvd
- 0000 Pamela Dr
- 000 Pamela Dr
- 1320 Kings Cir
- 1203 Pamela Dr
- 1798 David Dr
- 910 Mcgowan Rd
- 1410 Deborah Cir
- 401 Williamsfield Dr
- 509 Peach St
- 1302 Earl Rd
- 914 Parkwood Rd
- 912 Parkwood Rd
- 1716 Arbor Way Dr
- 812 Kings Rd
- 817 Cabaniss Dr
- 1545 Hilltop Dr
- 1545 Hilltop Dr Unit 19
- 819 Cabaniss Dr
- 820 E Main St
- 1543 Hilltop Dr
- 1547 Hilltop Dr
- 817 E Main St
- 1541 Hilltop Dr
- 1549 Hilltop Dr
- 822 E Main St
- 819 E Main St
- 821 Cabaniss Dr
- 820 Cabaniss Dr
- 821 E Main St
- 824 E Main St
- 1551 Hilltop Dr
- 825 Cabaniss Dr
- 813 E Main St
- 1546 Hilltop Dr
Your Personal Tour Guide
Ask me questions while you tour the home.