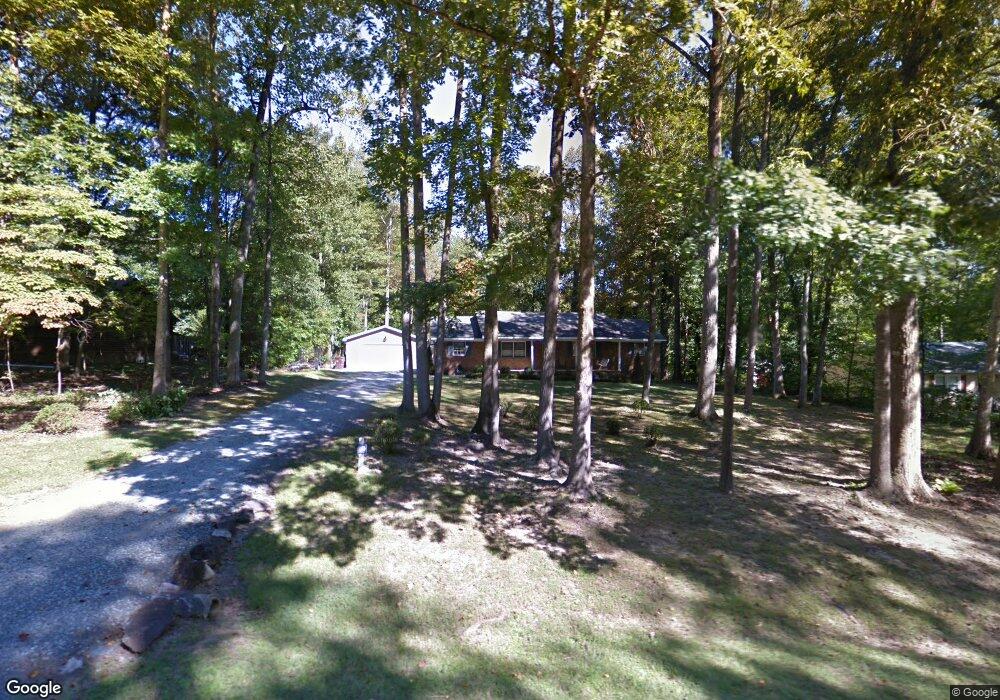
816 Knight Dr Durham, NC 27712
North Durham NeighborhoodEstimated Value: $336,000 - $402,000
3
Beds
2
Baths
1,685
Sq Ft
$220/Sq Ft
Est. Value
About This Home
This home is located at 816 Knight Dr, Durham, NC 27712 and is currently estimated at $371,535, approximately $220 per square foot. 816 Knight Dr is a home located in Durham County with nearby schools including Eno Valley Elementary, George L Carrington Middle, and Northern High School.
Ownership History
Date
Name
Owned For
Owner Type
Purchase Details
Closed on
Mar 27, 2015
Sold by
Branch Clyde E and Branch Lisa P
Bought by
Fuentes Andrew M and Fuentes Tracie
Current Estimated Value
Home Financials for this Owner
Home Financials are based on the most recent Mortgage that was taken out on this home.
Original Mortgage
$172,633
Outstanding Balance
$131,704
Interest Rate
3.89%
Mortgage Type
VA
Estimated Equity
$239,831
Purchase Details
Closed on
May 25, 2004
Sold by
Huffman Ben M and Huffman Laura L
Bought by
Branch Clyde E and Branch Lisa P
Home Financials for this Owner
Home Financials are based on the most recent Mortgage that was taken out on this home.
Original Mortgage
$112,800
Interest Rate
5.77%
Mortgage Type
Purchase Money Mortgage
Purchase Details
Closed on
Nov 1, 1997
Sold by
Eric Turner James and Eric Anne Melody
Bought by
Huffman Ben M and Huffman Laura L
Home Financials for this Owner
Home Financials are based on the most recent Mortgage that was taken out on this home.
Original Mortgage
$96,400
Interest Rate
7.27%
Mortgage Type
Purchase Money Mortgage
Create a Home Valuation Report for This Property
The Home Valuation Report is an in-depth analysis detailing your home's value as well as a comparison with similar homes in the area
Home Values in the Area
Average Home Value in this Area
Purchase History
| Date | Buyer | Sale Price | Title Company |
|---|---|---|---|
| Fuentes Andrew M | $169,000 | None Available | |
| Branch Clyde E | $141,000 | -- | |
| Huffman Ben M | $123,000 | -- |
Source: Public Records
Mortgage History
| Date | Status | Borrower | Loan Amount |
|---|---|---|---|
| Open | Fuentes Andrew M | $172,633 | |
| Previous Owner | Branch Clyde E | $112,800 | |
| Previous Owner | Huffman Ben M | $96,400 |
Source: Public Records
Tax History
| Year | Tax Paid | Tax Assessment Tax Assessment Total Assessment is a certain percentage of the fair market value that is determined by local assessors to be the total taxable value of land and additions on the property. | Land | Improvement |
|---|---|---|---|---|
| 2025 | $2,498 | $343,799 | $85,000 | $258,799 |
| 2024 | $2,211 | $212,322 | $42,500 | $169,822 |
| 2023 | $2,096 | $212,322 | $42,500 | $169,822 |
| 2022 | $2,012 | $212,322 | $42,500 | $169,822 |
| 2021 | $1,799 | $212,322 | $42,500 | $169,822 |
| 2020 | $1,762 | $212,322 | $42,500 | $169,822 |
| 2019 | $1,762 | $212,322 | $42,500 | $169,822 |
| 2018 | $1,527 | $170,944 | $34,000 | $136,944 |
| 2017 | $1,510 | $170,944 | $34,000 | $136,944 |
| 2016 | $1,446 | $170,944 | $34,000 | $136,944 |
| 2015 | $1,501 | $151,390 | $31,214 | $120,176 |
| 2014 | $1,501 | $151,390 | $31,214 | $120,176 |
Source: Public Records
Map
Nearby Homes
- 5805 Prioress Dr
- 5809 Prioress Dr
- 5801 Prioress Dr
- 5929 Guess Rd
- 6014 Guess Rd
- 816 Running Cedar Trail
- 6044 Scalybark Rd
- 5620 Birch Dr
- 600 Birchrun Dr
- 5820 Genesee Dr
- 5857 Genesee Dr
- 707 Donlee Dr
- 7 Starwood Ln
- 1310 Bramble Dr
- 5610 Genesee Dr
- 512 W Bywood Dr
- 1109 Prominence Dr
- 1108 Prominence Dr
- 1112 Prominence Dr
- 2004 Upland Ln
Your Personal Tour Guide
Ask me questions while you tour the home.