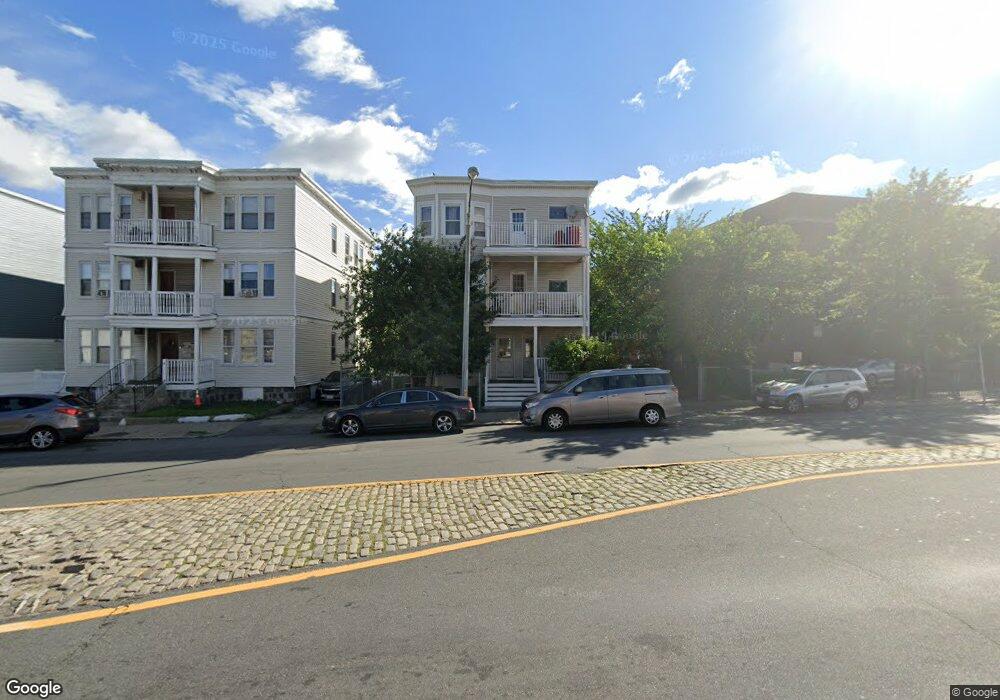
816 Morton St Mattapan, MA 02126
Franklin Field South NeighborhoodEstimated Value: $1,133,000 - $1,174,000
9
Beds
3
Baths
3,834
Sq Ft
$300/Sq Ft
Est. Value
About This Home
This home is located at 816 Morton St, Mattapan, MA 02126 and is currently estimated at $1,149,667, approximately $299 per square foot. 816 Morton St is a home located in Suffolk County with nearby schools including KIPP Academy Boston Charter School and Berea Seventh-day Adventist Academy.
Ownership History
Date
Name
Owned For
Owner Type
Purchase Details
Closed on
Oct 7, 1994
Sold by
Halstead Hilton S
Bought by
Dumas Louis Charles
Current Estimated Value
Home Financials for this Owner
Home Financials are based on the most recent Mortgage that was taken out on this home.
Original Mortgage
$69,964
Interest Rate
8.55%
Mortgage Type
Purchase Money Mortgage
Create a Home Valuation Report for This Property
The Home Valuation Report is an in-depth analysis detailing your home's value as well as a comparison with similar homes in the area
Home Values in the Area
Average Home Value in this Area
Purchase History
| Date | Buyer | Sale Price | Title Company |
|---|---|---|---|
| Dumas Louis Charles | $70,000 | -- |
Source: Public Records
Mortgage History
| Date | Status | Borrower | Loan Amount |
|---|---|---|---|
| Closed | Dumas Louis Charles | $69,964 |
Source: Public Records
Tax History Compared to Growth
Tax History
| Year | Tax Paid | Tax Assessment Tax Assessment Total Assessment is a certain percentage of the fair market value that is determined by local assessors to be the total taxable value of land and additions on the property. | Land | Improvement |
|---|---|---|---|---|
| 2025 | $11,244 | $971,000 | $248,000 | $723,000 |
| 2024 | $10,725 | $983,900 | $263,500 | $720,400 |
| 2023 | $9,877 | $919,600 | $246,300 | $673,300 |
| 2022 | $9,176 | $843,400 | $225,900 | $617,500 |
| 2021 | $8,570 | $803,200 | $215,100 | $588,100 |
| 2020 | $7,641 | $723,600 | $255,300 | $468,300 |
| 2019 | $6,634 | $629,400 | $156,800 | $472,600 |
| 2018 | $5,734 | $547,100 | $156,800 | $390,300 |
| 2017 | $5,413 | $511,100 | $156,800 | $354,300 |
| 2016 | $4,890 | $444,500 | $156,800 | $287,700 |
| 2015 | $4,122 | $340,400 | $106,900 | $233,500 |
| 2014 | -- | $295,900 | $106,900 | $189,000 |
Source: Public Records
Map
Nearby Homes
- 10 Sutton St
- 5 Sutton St
- 5 Sutton St Unit 3B
- 18 Astoria St
- 67 Wildwood St
- 24 Marden Ave
- 10 Hosmer St
- 68 Mascot St
- 15-17 W Selden St
- 808 Morton St Unit 3
- 139 Selden St
- 38 Mascot St Unit 3
- 6 Deering Rd
- 32 Crowell St
- 124 Selden St
- 14-16 Jacob St
- 23 Fessenden St
- 25 Fessenden St
- 567B Norfolk St
- 69 Lucerne St
- 816 Morton St
- 812 Morton St
- 815 Morton St Unit 18
- 815 Morton St Unit 21
- 815 Morton St
- 815 Morton St Unit 9999
- 819 Morton St
- 420-422 Norfolk St Unit 2
- 420 Norfolk St Unit 422
- 420 Norfolk St Unit 422
- 420 Norfolk St Unit 422
- 420 Norfolk St Unit 1
- 420 Norfolk St Unit 3
- 420-422 Norfolk St
- 420-422 Norfolk St Unit 1
- 420-422 Norfolk St Unit 3
- 422 Norfolk St Unit 3
- 420 Norfolk St Unit 2
- 834 Morton St
- 838 Morton St