Estimated Value: $203,000
3
Beds
2
Baths
1,048
Sq Ft
$194/Sq Ft
Est. Value
About This Home
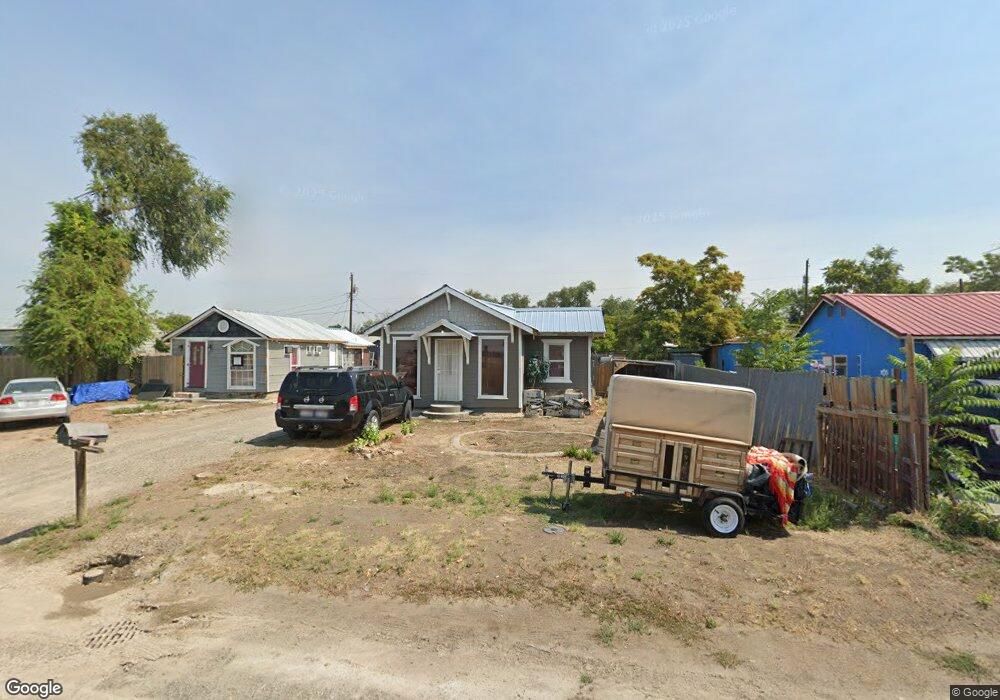
This home is located at 816 N 3rd St Unit 1, Nyssa, OR 97913 and is currently estimated at $203,000, approximately $193 per square foot. 816 N 3rd St Unit 1 is a home located in Malheur County with nearby schools including Nyssa Elementary School, Nyssa Middle School, and Nyssa High School.
Ownership History
Date
Name
Owned For
Owner Type
Purchase Details
Closed on
May 4, 2022
Sold by
State Of Oregon
Bought by
Goverment Land Sales
Current Estimated Value
Purchase Details
Closed on
Feb 11, 2011
Sold by
Margarita Morales
Bought by
Valdez Rosa
Purchase Details
Closed on
Apr 23, 2007
Sold by
Valdez Rosa
Bought by
Morales Margarita G
Home Financials for this Owner
Home Financials are based on the most recent Mortgage that was taken out on this home.
Original Mortgage
$50,400
Interest Rate
9.8%
Mortgage Type
Adjustable Rate Mortgage/ARM
Create a Home Valuation Report for This Property
The Home Valuation Report is an in-depth analysis detailing your home's value as well as a comparison with similar homes in the area
Home Values in the Area
Average Home Value in this Area
Purchase History
| Date | Buyer | Sale Price | Title Company |
|---|---|---|---|
| Goverment Land Sales | $3,100 | None Listed On Document | |
| Valdez Rosa | -- | -- | |
| Morales Margarita G | $63,000 | -- |
Source: Public Records
Mortgage History
| Date | Status | Borrower | Loan Amount |
|---|---|---|---|
| Previous Owner | Morales Margarita G | $50,400 |
Source: Public Records
Tax History Compared to Growth
Tax History
| Year | Tax Paid | Tax Assessment Tax Assessment Total Assessment is a certain percentage of the fair market value that is determined by local assessors to be the total taxable value of land and additions on the property. | Land | Improvement |
|---|---|---|---|---|
| 2025 | $765 | $42,114 | $7,162 | $34,952 |
| 2024 | $747 | $40,888 | $7,961 | $32,927 |
| 2023 | $728 | $39,698 | $9,043 | $30,655 |
| 2022 | $712 | $38,542 | $11,435 | $27,107 |
| 2021 | $694 | $37,420 | $10,718 | $26,702 |
| 2020 | $677 | $36,331 | $11,367 | $24,964 |
| 2019 | $660 | $35,273 | $11,336 | $23,937 |
| 2018 | $640 | $34,246 | $12,276 | $21,970 |
| 2017 | $619 | $33,249 | $11,919 | $21,330 |
| 2016 | $606 | $32,281 | $11,572 | $20,709 |
| 2015 | $540 | $31,341 | $10,168 | $21,173 |
| 2014 | $587 | $30,429 | $10,615 | $19,814 |
Source: Public Records
Map
Nearby Homes