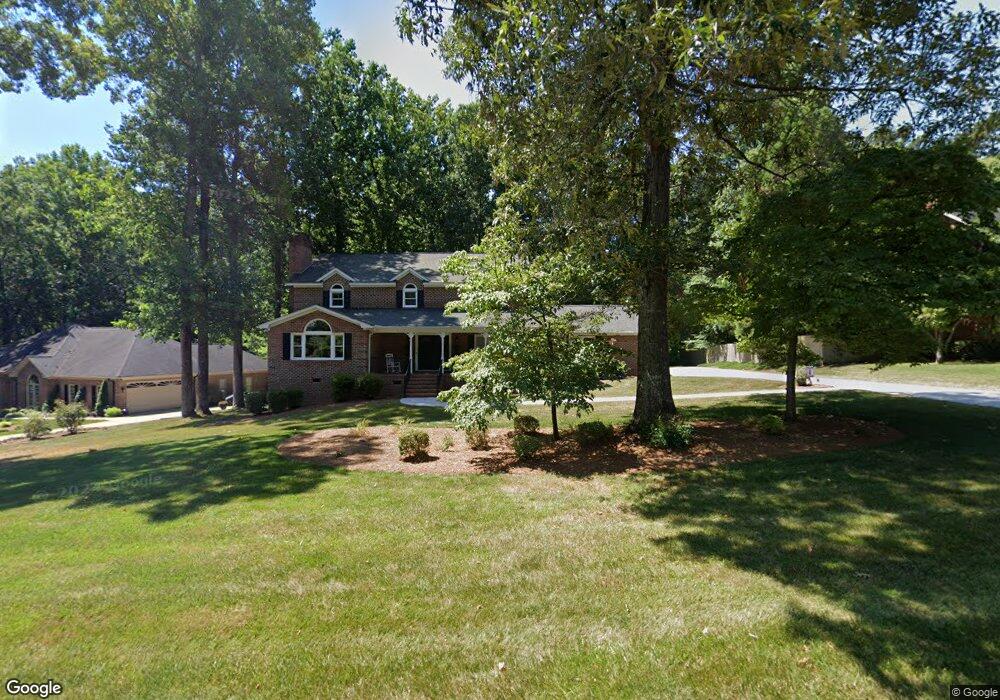
816 Newbern Ave Asheboro, NC 27205
Estimated Value: $346,000 - $487,000
--
Bed
3
Baths
3,262
Sq Ft
$136/Sq Ft
Est. Value
About This Home
This home is located at 816 Newbern Ave, Asheboro, NC 27205 and is currently estimated at $443,136, approximately $135 per square foot. 816 Newbern Ave is a home located in Randolph County with nearby schools including Guy B. Teachey Elementary School, South Asheboro Middle School, and Asheboro High School.
Ownership History
Date
Name
Owned For
Owner Type
Purchase Details
Closed on
Apr 25, 2023
Sold by
Scott Rush Brandunn and Graves Karla
Bought by
Beane Zachary and Beane Joaniebeth
Current Estimated Value
Home Financials for this Owner
Home Financials are based on the most recent Mortgage that was taken out on this home.
Original Mortgage
$360,000
Outstanding Balance
$346,678
Interest Rate
5.2%
Mortgage Type
New Conventional
Estimated Equity
$96,458
Purchase Details
Closed on
Sep 27, 2010
Sold by
Rush Elizabeth D and Rush Beth D
Bought by
Graves Rush Brandunn Scott and Graves Rush Karla
Home Financials for this Owner
Home Financials are based on the most recent Mortgage that was taken out on this home.
Original Mortgage
$292,500
Interest Rate
3.75%
Mortgage Type
New Conventional
Create a Home Valuation Report for This Property
The Home Valuation Report is an in-depth analysis detailing your home's value as well as a comparison with similar homes in the area
Home Values in the Area
Average Home Value in this Area
Purchase History
| Date | Buyer | Sale Price | Title Company |
|---|---|---|---|
| Beane Zachary | $400,000 | None Listed On Document | |
| Graves Rush Brandunn Scott | $325,000 | None Available |
Source: Public Records
Mortgage History
| Date | Status | Borrower | Loan Amount |
|---|---|---|---|
| Open | Beane Zachary | $360,000 | |
| Previous Owner | Graves Rush Brandunn Scott | $292,500 |
Source: Public Records
Tax History Compared to Growth
Tax History
| Year | Tax Paid | Tax Assessment Tax Assessment Total Assessment is a certain percentage of the fair market value that is determined by local assessors to be the total taxable value of land and additions on the property. | Land | Improvement |
|---|---|---|---|---|
| 2025 | $5,095 | $384,060 | $56,500 | $327,560 |
| 2024 | $5,429 | $384,060 | $56,500 | $327,560 |
| 2023 | $5,429 | $409,260 | $56,500 | $352,760 |
| 2022 | $4,146 | $287,220 | $36,000 | $251,220 |
| 2021 | $4,146 | $287,220 | $36,000 | $251,220 |
| 2020 | $4,146 | $287,220 | $36,000 | $251,220 |
| 2019 | $4,146 | $287,220 | $36,000 | $251,220 |
| 2018 | $4,223 | $287,750 | $42,810 | $244,940 |
| 2016 | $4,223 | $287,749 | $42,810 | $244,939 |
| 2015 | $4,230 | $287,749 | $42,810 | $244,939 |
| 2014 | $4,129 | $287,749 | $42,810 | $244,939 |
Source: Public Records
Map
Nearby Homes
- 888 Newbern Ave
- 947 Rockcliff Terrace
- 431 Newbern Ave
- 2473 Zoo Pkwy
- 0 Sykes Farm Rd
- 424 Northampton Dr
- 643 Cypress Dr
- 0 Sequoia Ave
- 640 Hemlock Dr
- 604 Hemlock Dr
- 1236 Pepperidge Rd
- 228 Anchor Dr
- 287 Eldorado Rd
- 0 U S Highway 64
- 0 Bray Blvd
- 261 Charles Ave
- 0 Browers Chapel Rd
- 897 Bray Blvd
- 353 Auman Ave
- 1427 S Fayetteville St
- 802 Newbern Ave
- 830 Newbern Ave
- 773 Laurel Dr
- 693 Brown Trail
- 840 Newbern Ave
- 780 Newbern Ave
- 829 Newbern Ave
- 761 Laurel Dr
- 837 Newbern Ave
- 685 Brown Trail
- 862 Newbern Ave
- 811 Laurel Dr
- 768 Newbern Ave
- 789 Laurel Dr
- 779 Newbern Ave
- 845 Newbern Ave
- 749 Laurel Dr
- 821 Laurel Dr
- 759 Newbern Ave
- 671 Brown Trail