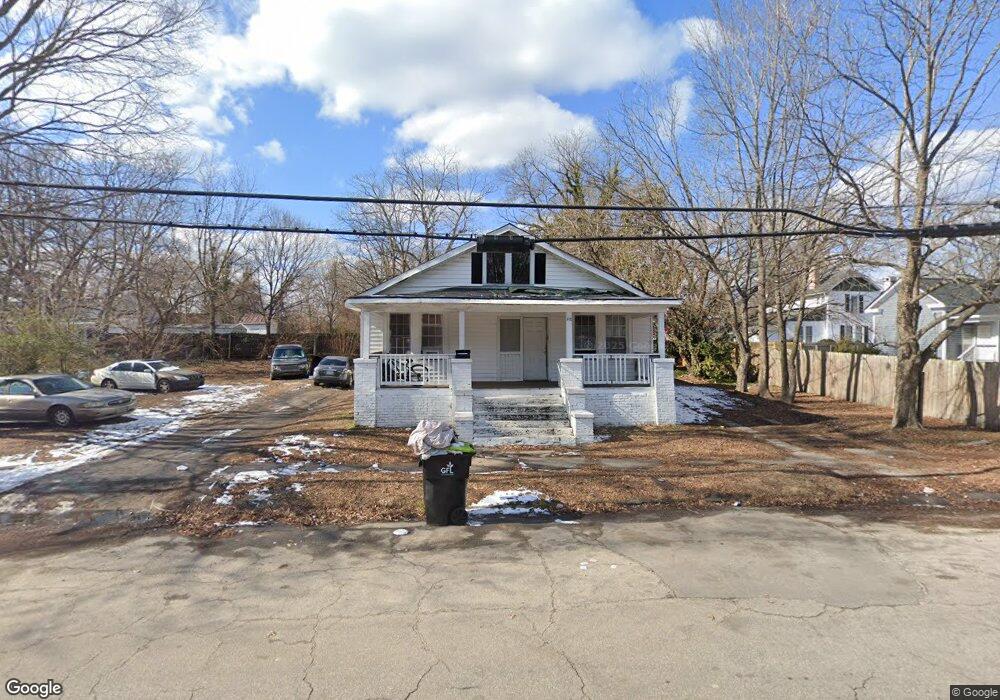
816 Nicholas St Unit 818 Henderson, NC 27536
Estimated Value: $73,000 - $171,000
4
Beds
2
Baths
1,788
Sq Ft
$68/Sq Ft
Est. Value
About This Home
This home is located at 816 Nicholas St Unit 818, Henderson, NC 27536 and is currently estimated at $121,873, approximately $68 per square foot. 816 Nicholas St Unit 818 is a home located in Vance County with nearby schools including L.B. Yancey Elementary School, Henderson Middle School, and Southern Vance High School.
Ownership History
Date
Name
Owned For
Owner Type
Purchase Details
Closed on
Jul 10, 2025
Sold by
Alston Property Llc
Bought by
Main Stream Capital Investments Llc
Current Estimated Value
Home Financials for this Owner
Home Financials are based on the most recent Mortgage that was taken out on this home.
Original Mortgage
$400,000
Outstanding Balance
$335,227
Interest Rate
6.89%
Mortgage Type
Construction
Estimated Equity
-$213,354
Purchase Details
Closed on
Sep 22, 2020
Sold by
Ttxd Investments Llc
Bought by
Alston Property Llc
Purchase Details
Closed on
Mar 5, 2019
Sold by
Proffitt Investments Inc
Bought by
Ttxd Investments Llc
Purchase Details
Closed on
Jul 14, 2010
Sold by
Smith Stacey L
Bought by
Proffitt Investments Inc
Purchase Details
Closed on
Dec 5, 2008
Sold by
American General Financial Services Inc
Bought by
Smith Stacey L
Create a Home Valuation Report for This Property
The Home Valuation Report is an in-depth analysis detailing your home's value as well as a comparison with similar homes in the area
Home Values in the Area
Average Home Value in this Area
Purchase History
| Date | Buyer | Sale Price | Title Company |
|---|---|---|---|
| Main Stream Capital Investments Llc | $300,000 | None Listed On Document | |
| Main Stream Capital Investments Llc | $300,000 | None Listed On Document | |
| Alston Property Llc | $70,000 | None Available | |
| Ttxd Investments Llc | $60,000 | None Available | |
| Proffitt Investments Inc | $12,000 | -- | |
| Smith Stacey L | $9,500 | -- |
Source: Public Records
Mortgage History
| Date | Status | Borrower | Loan Amount |
|---|---|---|---|
| Open | Main Stream Capital Investments Llc | $400,000 | |
| Closed | Main Stream Capital Investments Llc | $400,000 |
Source: Public Records
Tax History Compared to Growth
Tax History
| Year | Tax Paid | Tax Assessment Tax Assessment Total Assessment is a certain percentage of the fair market value that is determined by local assessors to be the total taxable value of land and additions on the property. | Land | Improvement |
|---|---|---|---|---|
| 2025 | $1,399 | $102,685 | $4,600 | $98,085 |
| 2024 | $1,649 | $102,685 | $4,600 | $98,085 |
| 2023 | $632 | $23,917 | $3,476 | $20,441 |
| 2022 | $623 | $23,917 | $3,476 | $20,441 |
| 2021 | $383 | $23,917 | $3,476 | $20,441 |
| 2020 | $617 | $23,917 | $3,476 | $20,441 |
| 2019 | $607 | $23,917 | $3,476 | $20,441 |
| 2018 | $383 | $23,917 | $3,476 | $20,441 |
| 2017 | $593 | $23,917 | $3,476 | $20,441 |
| 2016 | $593 | $23,917 | $3,476 | $20,441 |
| 2015 | $369 | $30,480 | $6,864 | $23,616 |
| 2014 | $640 | $30,482 | $6,864 | $23,618 |
Source: Public Records
Map
Nearby Homes
- 903 Nicholas St
- 845 S William St
- 216 Chavasse Ave
- 275 Gholson Ave
- 00 Young Ave
- 713 Champion St
- 500 Zene St
- 533 E Winder St
- 128 Carolina Ave
- 410 E Montgomery St
- 605 E Montgomery St
- 166 W Belle St
- 925 S Chestnut St
- 830 S Chestnut St
- 422 Harriett St
- 505 Harriett St
- 1105 S Chestnut St
- 735 Alexander Ave
- 714 Harriett St
- 232 Burwell Ave
- 816 Nicholas St Unit 1
- 280 Chavasse Ave
- 828 Nicholas St
- 270 Chavasse Ave
- 261 Davis St
- 815 Nicholas St
- 304 Chavasse Ave
- 304 A/B Chavasse Ave
- 260 Chavasse Ave
- 825 Nicholas St
- 0 Chavasse Ave
- 306 Chavasse Ave
- 249 Davis St
- 835 Nicholas St
- 277 Chavasse Ave
- 273 Chavasse Ave
- 316 Chavasse Ave
- 287 Chavasse Ave
- 305 Chavasse Ave
- 309 Davis St Unit 311