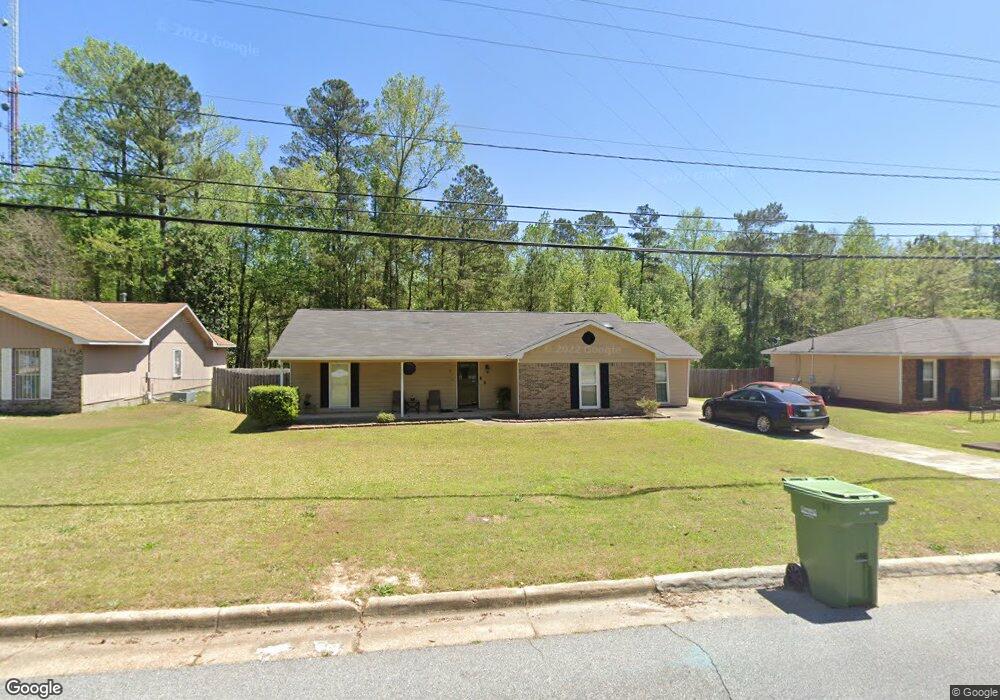
816 Omega Dr Columbus, GA 31907
Estimated Value: $163,870 - $192,000
3
Beds
3
Baths
1,420
Sq Ft
$124/Sq Ft
Est. Value
About This Home
This home is located at 816 Omega Dr, Columbus, GA 31907 and is currently estimated at $175,718, approximately $123 per square foot. 816 Omega Dr is a home located in Muscogee County with nearby schools including Georgetown Elementary School, East Columbus Magnet Academy, and Kendrick High School.
Ownership History
Date
Name
Owned For
Owner Type
Purchase Details
Closed on
Dec 15, 2011
Sold by
Powers Investments Llc
Bought by
Williams Kevin T
Current Estimated Value
Home Financials for this Owner
Home Financials are based on the most recent Mortgage that was taken out on this home.
Original Mortgage
$90,544
Outstanding Balance
$62,530
Interest Rate
4.21%
Mortgage Type
FHA
Estimated Equity
$113,188
Purchase Details
Closed on
Sep 6, 2011
Sold by
Bank Of America National A
Bought by
Powers Investments Llc
Home Financials for this Owner
Home Financials are based on the most recent Mortgage that was taken out on this home.
Original Mortgage
$59,475
Interest Rate
4.38%
Mortgage Type
New Conventional
Purchase Details
Closed on
Dec 7, 2010
Sold by
Anderson Marshon
Bought by
Bank Of America National Assoc
Create a Home Valuation Report for This Property
The Home Valuation Report is an in-depth analysis detailing your home's value as well as a comparison with similar homes in the area
Home Values in the Area
Average Home Value in this Area
Purchase History
| Date | Buyer | Sale Price | Title Company |
|---|---|---|---|
| Williams Kevin T | $92,900 | -- | |
| Powers Investments Llc | $39,000 | -- | |
| Bank Of America National Assoc | $80,000 | -- |
Source: Public Records
Mortgage History
| Date | Status | Borrower | Loan Amount |
|---|---|---|---|
| Open | Williams Kevin T | $90,544 | |
| Previous Owner | Powers Investments Llc | $59,475 |
Source: Public Records
Tax History Compared to Growth
Tax History
| Year | Tax Paid | Tax Assessment Tax Assessment Total Assessment is a certain percentage of the fair market value that is determined by local assessors to be the total taxable value of land and additions on the property. | Land | Improvement |
|---|---|---|---|---|
| 2025 | $939 | $51,808 | $9,800 | $42,008 |
| 2024 | $937 | $51,808 | $9,800 | $42,008 |
| 2023 | $249 | $51,808 | $9,800 | $42,008 |
| 2022 | $977 | $47,496 | $9,800 | $37,696 |
| 2021 | $971 | $39,864 | $9,800 | $30,064 |
| 2020 | $971 | $39,864 | $9,800 | $30,064 |
| 2019 | $976 | $39,864 | $9,800 | $30,064 |
| 2018 | $976 | $39,864 | $9,800 | $30,064 |
| 2017 | $981 | $39,864 | $9,800 | $30,064 |
| 2016 | $985 | $37,160 | $6,127 | $31,033 |
| 2015 | $987 | $37,160 | $6,127 | $31,033 |
| 2014 | $989 | $37,160 | $6,127 | $31,033 |
| 2013 | -- | $37,160 | $6,127 | $31,033 |
Source: Public Records
Map
Nearby Homes
- 5833 Bunche St
- 6008 Walters Loop
- 6416 Sandy Bottom Dr
- 6223 Georgetown Dr
- 1252 School House Dr
- 6188 Valencia Dr
- 650 Upland Ct
- 908 Arlington Dr
- 5828 Georgetown Dr
- 803 Parkhill Dr
- 1322 Melford Dr
- 924 Vista Dr
- 5532 Buena Vista Rd
- 752 Wilder Dr
- 6620 Cove Cir
- 558 Wilder Dr
- 5526 Buena Vista Rd
- 1203 Amber Dr
- 5834 Blueridge Dr
- 5500 Amber Dr