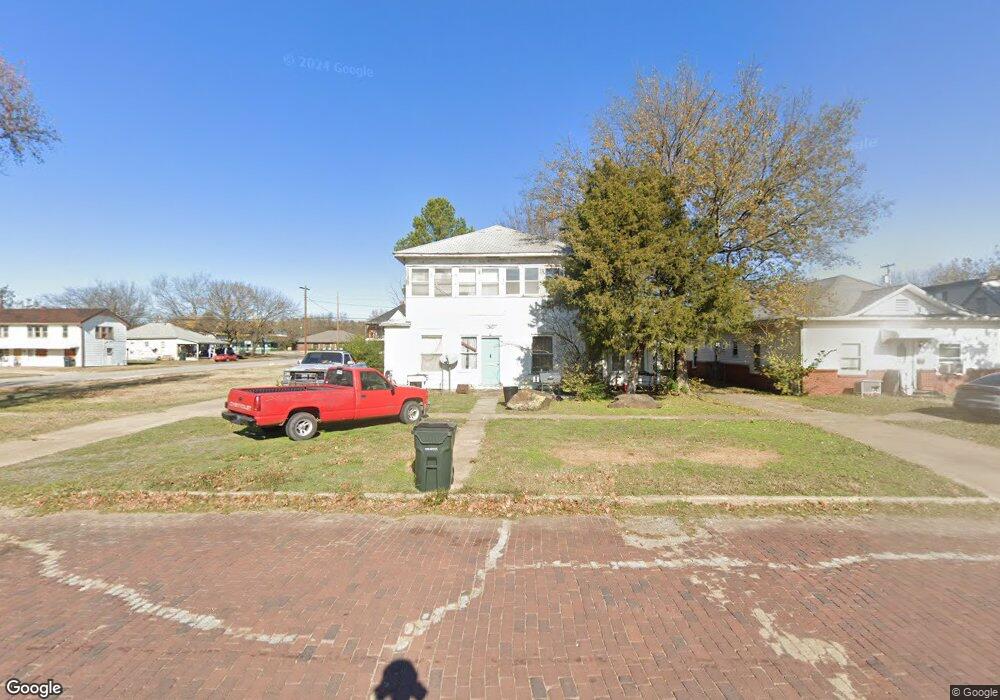
816 W Broadway St Henryetta, OK 74437
Estimated Value: $67,934 - $108,000
3
Beds
1
Bath
2,487
Sq Ft
$34/Sq Ft
Est. Value
About This Home
This home is located at 816 W Broadway St, Henryetta, OK 74437 and is currently estimated at $85,234, approximately $34 per square foot. 816 W Broadway St is a home located in Okmulgee County with nearby schools including Henryetta Elementary School, Henryetta Middle School, and Henryetta High School.
Ownership History
Date
Name
Owned For
Owner Type
Purchase Details
Closed on
Apr 21, 2021
Sold by
Robertson Tiffany Jo and Robertson Samuel D
Bought by
Brown Jennifer and Brown Gregg
Current Estimated Value
Purchase Details
Closed on
Nov 21, 2007
Sold by
Winn Karen K and Winn Roger L
Bought by
Berryhill Tiffany Jo
Home Financials for this Owner
Home Financials are based on the most recent Mortgage that was taken out on this home.
Original Mortgage
$32,000
Interest Rate
6.42%
Mortgage Type
FHA
Create a Home Valuation Report for This Property
The Home Valuation Report is an in-depth analysis detailing your home's value as well as a comparison with similar homes in the area
Home Values in the Area
Average Home Value in this Area
Purchase History
| Date | Buyer | Sale Price | Title Company |
|---|---|---|---|
| Brown Jennifer | $27,000 | None Available | |
| Berryhill Tiffany Jo | $42,666 | None Available |
Source: Public Records
Mortgage History
| Date | Status | Borrower | Loan Amount |
|---|---|---|---|
| Previous Owner | Berryhill Tiffany Jo | $32,000 |
Source: Public Records
Tax History
| Year | Tax Paid | Tax Assessment Tax Assessment Total Assessment is a certain percentage of the fair market value that is determined by local assessors to be the total taxable value of land and additions on the property. | Land | Improvement |
|---|---|---|---|---|
| 2025 | $531 | $4,916 | $240 | $4,676 |
| 2024 | $472 | $4,682 | $240 | $4,442 |
| 2023 | $456 | $4,682 | $240 | $4,442 |
| 2022 | $587 | $5,991 | $240 | $5,751 |
| 2021 | $595 | $5,991 | $240 | $5,751 |
| 2020 | $595 | $5,997 | $240 | $5,757 |
| 2019 | $567 | $5,789 | $240 | $5,549 |
| 2018 | $543 | $5,513 | $240 | $5,273 |
| 2017 | $518 | $5,251 | $240 | $5,011 |
| 2016 | $493 | $5,001 | $240 | $4,761 |
| 2015 | $377 | $4,762 | $240 | $4,522 |
| 2014 | $364 | $4,536 | $240 | $4,296 |
Source: Public Records
Map
Nearby Homes
- 803 W Moore St
- 909 W Ragan St
- 104500 S 4095 Rd
- 802 W Gentry St
- 1209 W Ragan St
- 205 W Ragan St
- 2201 W Main St
- 303 W Cummings St
- 512 N 4th St
- 1215 Wade Wells Dr
- 201 E Main St
- 205 W Washington St
- 112 W Merrick St
- 906 N 14th St
- 214 N B St
- 318 E Trudgeon St
- 612 NE 1st St
- 608 Pine St
- 0 E Corporation St
- 202 E John St
- 814 W Broadway St
- 824 W Broadway St
- 810 W Broadway St
- 806 W Broadway St
- 104 S 9th St
- 821 W Main St
- 811 W Main St
- 902 W Broadway St
- 105 S 9th St
- 815 W Broadway St
- 823 W Broadway St
- 106 N 9th St
- 901 W Broadway St
- 908 W Broadway St
- 824 W Main St
- 724 W Broadway St
- 820 W Main St
- 905 W Broadway St
- 208 S 9th St
Your Personal Tour Guide
Ask me questions while you tour the home.