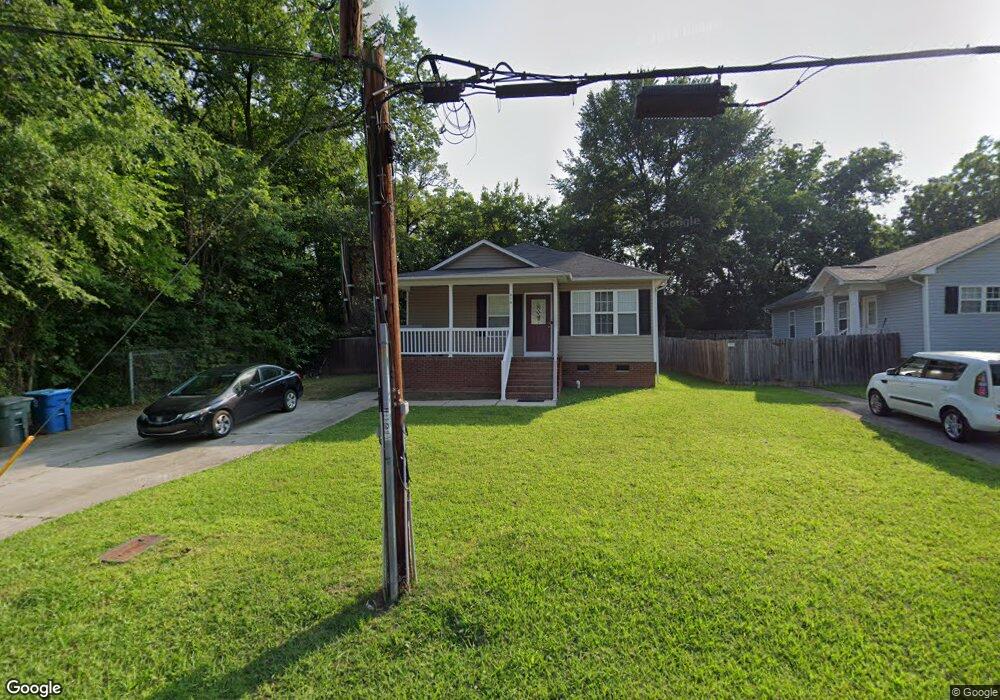
816 W Fisher St Salisbury, NC 28144
Estimated Value: $225,000 - $272,000
--
Bed
2
Baths
1,380
Sq Ft
$176/Sq Ft
Est. Value
About This Home
This home is located at 816 W Fisher St, Salisbury, NC 28144 and is currently estimated at $242,947, approximately $176 per square foot. 816 W Fisher St is a home located in Rowan County with nearby schools including H D Isenberg Elementary, Knox Middle School, and North Rowan Middle School.
Ownership History
Date
Name
Owned For
Owner Type
Purchase Details
Closed on
Jul 17, 2015
Sold by
Salisbury Community Development Corp
Bought by
Chica Carranza Manuel H
Current Estimated Value
Home Financials for this Owner
Home Financials are based on the most recent Mortgage that was taken out on this home.
Original Mortgage
$10,000
Outstanding Balance
$7,767
Interest Rate
3.75%
Mortgage Type
FHA
Estimated Equity
$235,180
Purchase Details
Closed on
May 30, 2014
Sold by
Farmers & Merchants Bank
Bought by
Salisbury Community Development Corp
Purchase Details
Closed on
Aug 29, 2004
Sold by
Salisbury Community Development Corp
Bought by
Stevenson Torrance P and Stevenson Lasheika B
Home Financials for this Owner
Home Financials are based on the most recent Mortgage that was taken out on this home.
Original Mortgage
$89,500
Interest Rate
5.64%
Mortgage Type
Fannie Mae Freddie Mac
Purchase Details
Closed on
Oct 21, 2003
Sold by
Johnson Wilhelmina F and Feaster Oliver W
Bought by
Salisbury Community Development Corp
Create a Home Valuation Report for This Property
The Home Valuation Report is an in-depth analysis detailing your home's value as well as a comparison with similar homes in the area
Home Values in the Area
Average Home Value in this Area
Purchase History
| Date | Buyer | Sale Price | Title Company |
|---|---|---|---|
| Chica Carranza Manuel H | $87,000 | Chicago Title Ins Co | |
| Salisbury Community Development Corp | $45,000 | None Available | |
| Farmers & Merchants Bank | $45,000 | None Available | |
| Stevenson Torrance P | $108,000 | -- | |
| Salisbury Community Development Corp | $29,000 | -- |
Source: Public Records
Mortgage History
| Date | Status | Borrower | Loan Amount |
|---|---|---|---|
| Open | Chica Carranza Manuel H | $10,000 | |
| Previous Owner | Stevenson Torrance P | $89,500 |
Source: Public Records
Tax History Compared to Growth
Tax History
| Year | Tax Paid | Tax Assessment Tax Assessment Total Assessment is a certain percentage of the fair market value that is determined by local assessors to be the total taxable value of land and additions on the property. | Land | Improvement |
|---|---|---|---|---|
| 2025 | $2,576 | $215,411 | $15,898 | $199,513 |
| 2024 | $2,576 | $215,411 | $15,898 | $199,513 |
| 2023 | $2,576 | $215,411 | $15,898 | $199,513 |
| 2022 | $1,637 | $118,864 | $12,365 | $106,499 |
| 2021 | $1,637 | $118,864 | $12,365 | $106,499 |
| 2020 | $1,637 | $118,864 | $12,365 | $106,499 |
| 2019 | $1,637 | $118,864 | $12,365 | $106,499 |
| 2018 | $1,336 | $98,360 | $12,364 | $85,996 |
| 2017 | $1,329 | $98,360 | $12,364 | $85,996 |
| 2016 | $1,293 | $98,360 | $12,364 | $85,996 |
| 2015 | $1,301 | $98,360 | $12,364 | $85,996 |
| 2014 | $1,284 | $98,232 | $11,187 | $87,045 |
Source: Public Records
Map
Nearby Homes
- 816 W Horah St
- 730 W Innes St
- 827 W Horah St
- 00 W Horah St
- 326 S Caldwell St
- 617 W Horah St
- 301 Lloyd St
- 525 W Horah St Unit Lot 9
- 1205 Kildare Dr Unit 5
- 1215 Kildare Dr Unit 6
- 1040 Beckham Rd
- 1210 Kildare Dr Unit 80
- 1160 Kildare Dr Unit 76
- 1175 Kildare Dr Unit 3
- 515 W Council St
- 408 S Ellis St
- 720 Holmes St
- 414 S Fulton St
- 418 S Fulton St
- 321 W Bank St
- 816 W Fisher St
- 812 W Fisher St
- 810 W Fisher St
- 808 W Fisher St
- 815 W Fisher St
- 804 W Fisher St
- 819 W Fisher St
- 811 W Fisher St
- 211 Vanderford St
- 801 W Fisher St
- 728 W Fisher St
- 216 Southwest St
- 727 W Fisher St
- 722 W Fisher St
- 724 W Fisher St
- 213 Southwest St
- 723 W Fisher St
- 217 Vanderford St
- 220 Southwest St
- 812 W Innes St