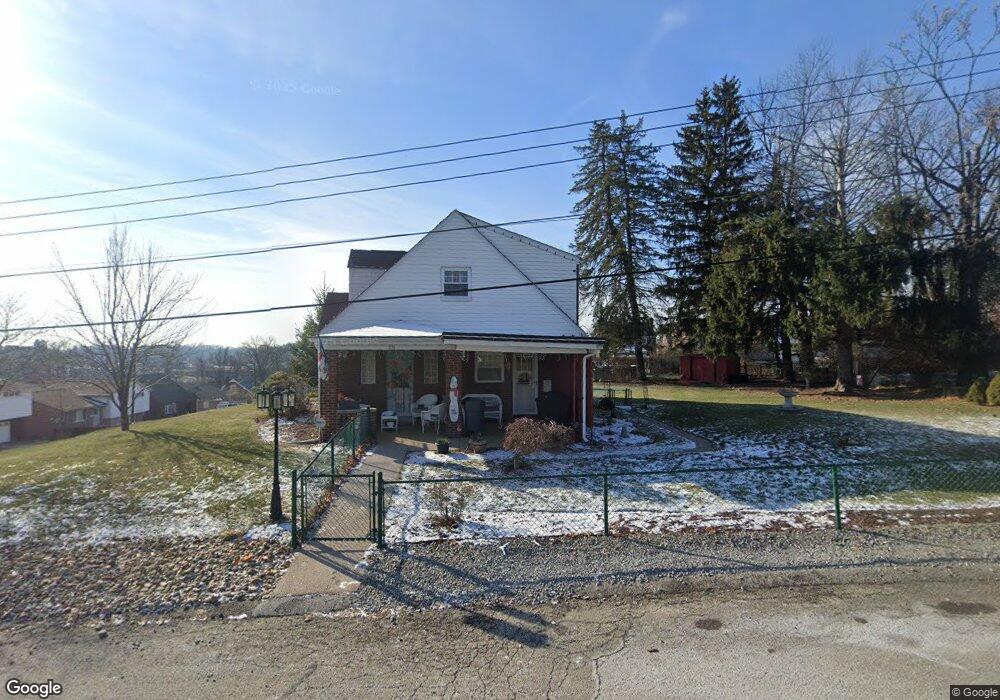
816 Willman St North Versailles, PA 15137
Estimated Value: $164,000 - $204,020
3
Beds
2
Baths
1,555
Sq Ft
$118/Sq Ft
Est. Value
About This Home
This home is located at 816 Willman St, North Versailles, PA 15137 and is currently estimated at $183,755, approximately $118 per square foot. 816 Willman St is a home located in Allegheny County with nearby schools including Logan Elementary School, Propel Cs-East, and Praise Christian Academy.
Ownership History
Date
Name
Owned For
Owner Type
Purchase Details
Closed on
Nov 19, 2019
Sold by
The Estate Of Martin J Good Jr
Bought by
Jeftenic Milica
Current Estimated Value
Purchase Details
Closed on
Oct 28, 2004
Sold by
Hetherington Mark
Bought by
Good Martin
Home Financials for this Owner
Home Financials are based on the most recent Mortgage that was taken out on this home.
Original Mortgage
$76,000
Outstanding Balance
$37,563
Interest Rate
5.74%
Mortgage Type
New Conventional
Estimated Equity
$146,192
Purchase Details
Closed on
Oct 5, 2000
Sold by
Hetherington Leslie A and Hetherington Mark R
Bought by
Hetherington Mark R
Purchase Details
Closed on
Oct 4, 2000
Sold by
Hetherington Leslie A and Hetherington Mark Richard
Bought by
Hetherington Mark Richard
Purchase Details
Closed on
Feb 26, 1999
Sold by
Bevan Dorothy P and Bevan Sarah E
Bought by
Hetherington Leslie A
Purchase Details
Closed on
Jan 1, 1900
Create a Home Valuation Report for This Property
The Home Valuation Report is an in-depth analysis detailing your home's value as well as a comparison with similar homes in the area
Home Values in the Area
Average Home Value in this Area
Purchase History
| Date | Buyer | Sale Price | Title Company |
|---|---|---|---|
| Jeftenic Milica | -- | None Available | |
| Good Martin | $126,000 | -- | |
| Hetherington Mark R | -- | -- | |
| Hetherington Mark Richard | -- | -- | |
| Hetherington Leslie A | $76,000 | -- | |
| -- | -- | -- |
Source: Public Records
Mortgage History
| Date | Status | Borrower | Loan Amount |
|---|---|---|---|
| Open | Good Martin | $76,000 |
Source: Public Records
Tax History Compared to Growth
Tax History
| Year | Tax Paid | Tax Assessment Tax Assessment Total Assessment is a certain percentage of the fair market value that is determined by local assessors to be the total taxable value of land and additions on the property. | Land | Improvement |
|---|---|---|---|---|
| 2025 | $517 | $80,400 | $18,700 | $61,700 |
| 2024 | $3,172 | $80,400 | $18,700 | $61,700 |
| 2023 | $3,172 | $80,400 | $18,700 | $61,700 |
| 2022 | $3,172 | $80,400 | $18,700 | $61,700 |
| 2021 | $380 | $80,400 | $18,700 | $61,700 |
| 2020 | $3,882 | $80,400 | $18,700 | $61,700 |
| 2019 | $3,882 | $98,400 | $18,700 | $79,700 |
| 2018 | $465 | $98,400 | $18,700 | $79,700 |
| 2017 | $3,882 | $98,400 | $18,700 | $79,700 |
| 2016 | $465 | $98,400 | $18,700 | $79,700 |
| 2015 | $465 | $98,400 | $18,700 | $79,700 |
| 2014 | $3,938 | $98,400 | $18,700 | $79,700 |
Source: Public Records
Map
Nearby Homes