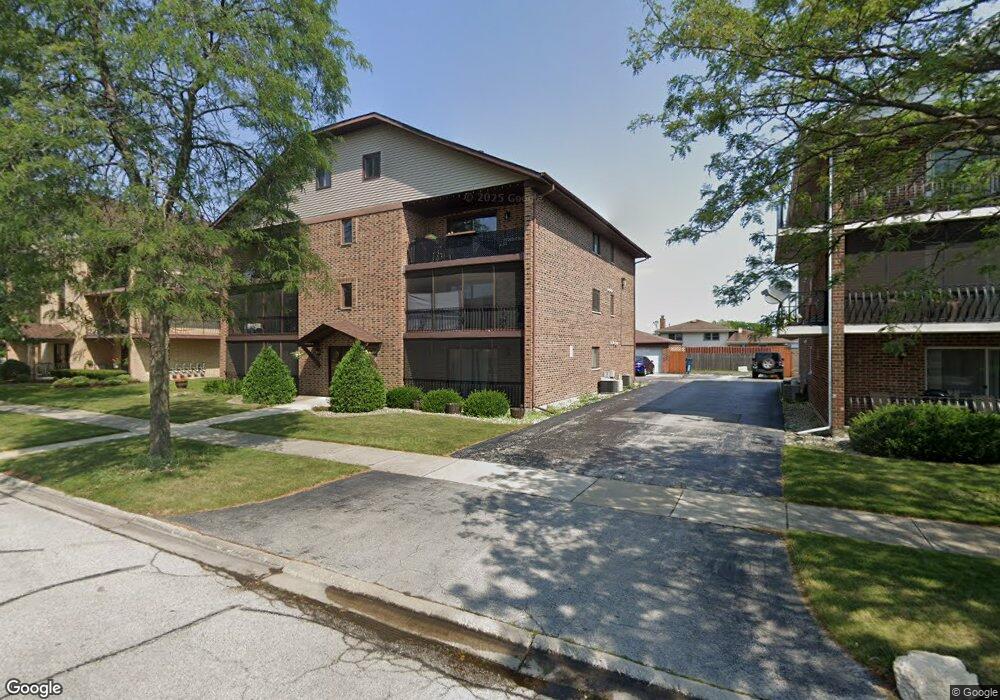
8160 168th Place Unit 1W1 Tinley Park, IL 60477
East Fernway Park NeighborhoodEstimated Value: $206,006 - $233,000
2
Beds
2
Baths
1,100
Sq Ft
$196/Sq Ft
Est. Value
About This Home
This home is located at 8160 168th Place Unit 1W1, Tinley Park, IL 60477 and is currently estimated at $215,752, approximately $196 per square foot. 8160 168th Place Unit 1W1 is a home located in Cook County with nearby schools including John A Bannes Elementary School, Virgil I Grissom Middle School, and Victor J Andrew High School.
Ownership History
Date
Name
Owned For
Owner Type
Purchase Details
Closed on
Apr 14, 2023
Sold by
Reese Helen
Bought by
Serrano Arael J and Monaloto Maria F
Current Estimated Value
Home Financials for this Owner
Home Financials are based on the most recent Mortgage that was taken out on this home.
Original Mortgage
$166,250
Outstanding Balance
$161,090
Interest Rate
5.99%
Mortgage Type
New Conventional
Estimated Equity
$54,662
Purchase Details
Closed on
Oct 14, 2002
Sold by
Reese Helen and Steyskal Julie E
Bought by
Reese Helen and Steyskal James
Purchase Details
Closed on
Oct 23, 1998
Sold by
Reese Helen
Bought by
Reese Helen and Steyskal Julie A
Purchase Details
Closed on
Jun 5, 1998
Sold by
Jorsch Robert and Drozd Linda K
Bought by
Reese Helen
Purchase Details
Closed on
Jan 2, 1997
Sold by
Jorsch Robert
Bought by
Jorsch Robert and Drozd Linda K
Create a Home Valuation Report for This Property
The Home Valuation Report is an in-depth analysis detailing your home's value as well as a comparison with similar homes in the area
Home Values in the Area
Average Home Value in this Area
Purchase History
| Date | Buyer | Sale Price | Title Company |
|---|---|---|---|
| Serrano Arael J | $175,000 | Chicago Title | |
| Reese Helen | -- | -- | |
| Reese Helen | -- | -- | |
| Reese Helen | -- | -- | |
| Jorsch Robert | -- | -- |
Source: Public Records
Mortgage History
| Date | Status | Borrower | Loan Amount |
|---|---|---|---|
| Open | Serrano Arael J | $166,250 |
Source: Public Records
Tax History Compared to Growth
Tax History
| Year | Tax Paid | Tax Assessment Tax Assessment Total Assessment is a certain percentage of the fair market value that is determined by local assessors to be the total taxable value of land and additions on the property. | Land | Improvement |
|---|---|---|---|---|
| 2024 | $2,960 | $16,631 | $1,165 | $15,466 |
| 2023 | $2,063 | $16,631 | $1,165 | $15,466 |
| 2022 | $2,063 | $11,943 | $896 | $11,047 |
| 2021 | $537 | $11,943 | $896 | $11,047 |
| 2020 | $487 | $11,943 | $896 | $11,047 |
| 2019 | $520 | $13,203 | $806 | $12,397 |
| 2018 | $510 | $13,203 | $806 | $12,397 |
| 2017 | $4,079 | $13,203 | $806 | $12,397 |
| 2016 | $861 | $11,281 | $716 | $10,565 |
| 2015 | $895 | $11,281 | $716 | $10,565 |
| 2014 | $869 | $11,281 | $716 | $10,565 |
| 2013 | $824 | $12,759 | $716 | $12,043 |
Source: Public Records
Map
Nearby Homes
- 8136 168th Place Unit 3E
- 8106 168th Place Unit 3W
- 8118 168th Place
- 7938 Paxton Ave Unit 3E
- 7925 Paxton Ave Unit 1A
- 16742 Paxton Ave Unit 2S
- 7913 Paxton Ave Unit 1W
- 8336 169th St
- 8229 170th St Unit 8229
- 16705 Paxton Ave
- 8400 167th St
- 16666 Parliament Ave
- 8444 W 171st St
- 16401 Tanbark Dr
- 17116 Dooneen Ave
- 16413 Prairie Dr
- 7810 166th Place
- 8456 170th Place
- 7914 164th Ct Unit 262
- 8440 Surrey Dr
- 8160 168th Place Unit 3E1
- 8160 168th Place Unit 1E1
- 8160 168th Place Unit 2E1
- 8160 168th Place Unit 3W2
- 8160 168th Place Unit 2W1
- 8160 168th Place Unit 3W1
- 8160 168th Place Unit 1W
- 8160 168th Place Unit 2E
- 8160 168th Place Unit 1E
- 8154 168th Pl Unit 3e
- 8154 168th Place Unit 1E2
- 8154 168th Place Unit 1W2
- 8154 168th Place Unit 2E2
- 8154 168th Place Unit 2W2
- 8154 168th Place Unit 3E2
- 8154 168th Place Unit 3E
- 8154 168th Place Unit 1W
- 8154 168th Place Unit 2W
- 8154 168th Place Unit 3W
- 8154 168th Place Unit 2E