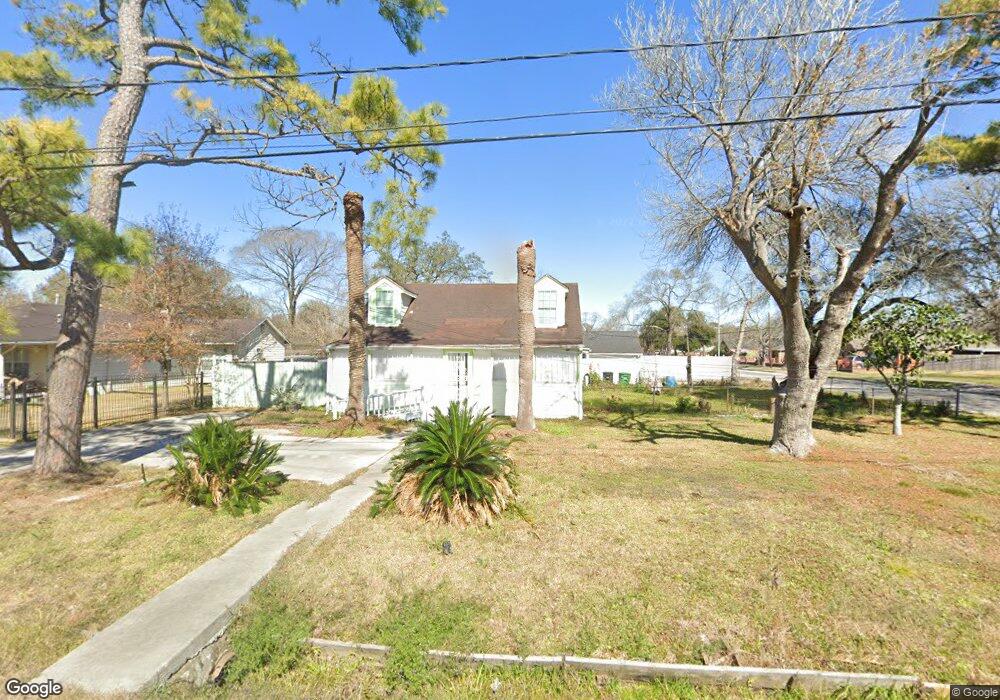
8163 Findlay St Houston, TX 77017
Park Place NeighborhoodEstimated Value: $276,020 - $354,000
3
Beds
1
Bath
2,384
Sq Ft
$134/Sq Ft
Est. Value
About This Home
This home is located at 8163 Findlay St, Houston, TX 77017 and is currently estimated at $320,255, approximately $134 per square foot. 8163 Findlay St is a home located in Harris County with nearby schools including Park Place Elementary School, Daniel Ortiz Middle School, and Chavez High School.
Ownership History
Date
Name
Owned For
Owner Type
Purchase Details
Closed on
Jan 17, 2019
Sold by
Nguyen Kim Ngoc Ho
Bought by
Nguyen Duc Tan
Current Estimated Value
Purchase Details
Closed on
Dec 17, 2018
Sold by
Nguyen Duc Tan
Bought by
Nguyen Kim Ngoc Ho
Purchase Details
Closed on
Jul 19, 2016
Sold by
Bui Ky C and Tran Lam Thi
Bought by
Nguyen Duc Tan
Purchase Details
Closed on
Mar 14, 2011
Sold by
Phan Kristie
Bought by
Tran Lam Thi
Purchase Details
Closed on
Dec 6, 2010
Sold by
Vu Tony
Bought by
Phan Kristie
Purchase Details
Closed on
Jan 13, 2009
Sold by
Ho Joseph Sau and Ho Luong
Bought by
Vu Tony
Purchase Details
Closed on
Jan 28, 1998
Sold by
Pham Cuc Margaret
Bought by
Ho Andrew Phuc
Purchase Details
Closed on
May 16, 1996
Sold by
Westin Bill
Bought by
Ho Andrew Phuc and Pham Cuc Margaret
Create a Home Valuation Report for This Property
The Home Valuation Report is an in-depth analysis detailing your home's value as well as a comparison with similar homes in the area
Home Values in the Area
Average Home Value in this Area
Purchase History
| Date | Buyer | Sale Price | Title Company |
|---|---|---|---|
| Nguyen Duc Tan | -- | None Available | |
| Nguyen Kim Ngoc Ho | -- | None Available | |
| Nguyen Duc Tan | -- | None Available | |
| Tran Lam Thi | -- | None Available | |
| Phan Kristie | -- | None Available | |
| Vu Tony | -- | None Available | |
| Ho Andrew Phuc | -- | -- | |
| Ho Andrew Phuc | -- | Houston Title |
Source: Public Records
Tax History Compared to Growth
Tax History
| Year | Tax Paid | Tax Assessment Tax Assessment Total Assessment is a certain percentage of the fair market value that is determined by local assessors to be the total taxable value of land and additions on the property. | Land | Improvement |
|---|---|---|---|---|
| 2025 | $1,172 | $344,056 | $70,875 | $273,181 |
| 2024 | $1,172 | $337,438 | $70,875 | $266,563 |
| 2023 | $3,491 | $285,871 | $70,875 | $214,996 |
| 2022 | $5,404 | $266,542 | $50,625 | $215,917 |
| 2021 | $5,200 | $241,796 | $50,625 | $191,171 |
| 2020 | $5,693 | $235,086 | $50,625 | $184,461 |
| 2019 | $4,953 | $195,734 | $43,031 | $152,703 |
| 2018 | $4,302 | $170,000 | $43,031 | $126,969 |
| 2017 | $4,299 | $170,000 | $43,031 | $126,969 |
| 2016 | $4,072 | $172,928 | $43,031 | $129,897 |
| 2015 | $994 | $172,928 | $43,031 | $129,897 |
| 2014 | $994 | $133,083 | $28,856 | $104,227 |
Source: Public Records
Map
Nearby Homes
- 8158 Easton St
- 8145 Easton St
- 8023 Findlay St
- 8324 Jennings St
- 7937 Grafton St
- 8250 Park Place Blvd Unit 303
- 8282 Park Place Blvd Unit D1
- 8282 Park Place Blvd Unit G2
- 8515 Carlisle St
- 3727 Broadway St
- 3743 Erie St
- 8502 Detroit St Unit D
- 8502 Detroit St Unit C
- 7313 Gulf Fwy Unit 814
- 7313 Gulf Fwy Unit 911
- 7313 Gulf Fwy Unit 1011
- 7303 Gulf Fwy Unit 903
- 8432 Park Place Blvd
- 3607 De Leon St
- 8135 Glenbrook Dr
- 8157 Findlay St
- 8151 Findlay St
- 3220 Hastings St
- 3207 Hastings St
- 8150 Easton St
- 8148 Easton St
- 8141 Findlay St
- 3308 Hastings St
- 8156 Findlay St
- 8202 Findlay St
- 3203 Hastings St
- 8211 Findlay St
- 8144 Easton St
- 8135 Findlay St
- 8206 Findlay St
- 8142 Findlay St
- 8138 Easton St
- 3307 Hastings St
- 8136 Findlay St
- 8129 Findlay St