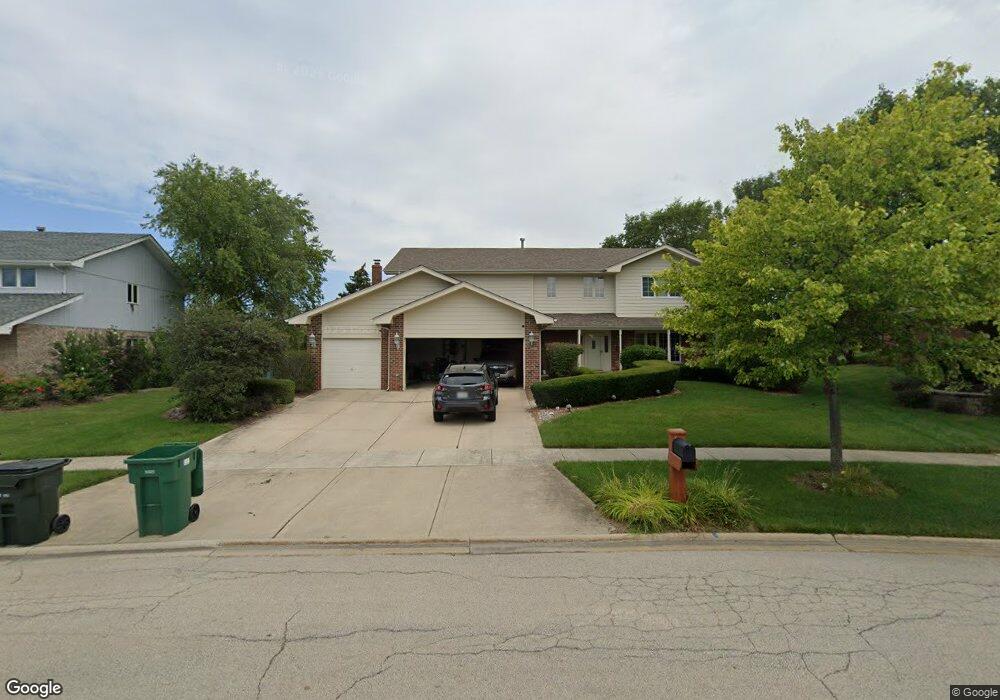
8168 Cove Ct Tinley Park, IL 60487
Brookside Glen NeighborhoodEstimated Value: $534,000 - $566,000
4
Beds
4
Baths
3,080
Sq Ft
$179/Sq Ft
Est. Value
About This Home
This home is located at 8168 Cove Ct, Tinley Park, IL 60487 and is currently estimated at $551,153, approximately $178 per square foot. 8168 Cove Ct is a home located in Will County with nearby schools including Summit Hill Junior High School, Lincoln-Way East High School, and Dr. Wolfe's Montessori School.
Ownership History
Date
Name
Owned For
Owner Type
Purchase Details
Closed on
May 1, 2006
Sold by
Haberkorn John J and Haberkorn Krista M
Bought by
Magdziasz Thomas F and Magdziasz Ann M
Current Estimated Value
Home Financials for this Owner
Home Financials are based on the most recent Mortgage that was taken out on this home.
Original Mortgage
$305,000
Outstanding Balance
$176,340
Interest Rate
6.37%
Mortgage Type
Fannie Mae Freddie Mac
Estimated Equity
$374,813
Purchase Details
Closed on
Nov 11, 1999
Sold by
Marquette National Bank
Bought by
Haberkorn John J and Haberkorn Krista M
Home Financials for this Owner
Home Financials are based on the most recent Mortgage that was taken out on this home.
Original Mortgage
$240,000
Interest Rate
6.87%
Create a Home Valuation Report for This Property
The Home Valuation Report is an in-depth analysis detailing your home's value as well as a comparison with similar homes in the area
Home Values in the Area
Average Home Value in this Area
Purchase History
| Date | Buyer | Sale Price | Title Company |
|---|---|---|---|
| Magdziasz Thomas F | $418,000 | Chicago Title Insurance Comp | |
| Haberkorn John J | $274,500 | Chicago Title Insurance Co |
Source: Public Records
Mortgage History
| Date | Status | Borrower | Loan Amount |
|---|---|---|---|
| Open | Magdziasz Thomas F | $305,000 | |
| Previous Owner | Haberkorn John J | $240,000 | |
| Closed | Haberkorn John J | $30,000 |
Source: Public Records
Tax History Compared to Growth
Tax History
| Year | Tax Paid | Tax Assessment Tax Assessment Total Assessment is a certain percentage of the fair market value that is determined by local assessors to be the total taxable value of land and additions on the property. | Land | Improvement |
|---|---|---|---|---|
| 2024 | $15,207 | $185,045 | $36,178 | $148,867 |
| 2023 | $15,207 | $165,263 | $32,310 | $132,953 |
| 2022 | $16,010 | $150,527 | $29,429 | $121,098 |
| 2021 | $13,304 | $140,824 | $27,532 | $113,292 |
| 2020 | $13,221 | $136,855 | $26,756 | $110,099 |
| 2019 | $12,879 | $133,192 | $26,040 | $107,152 |
| 2018 | $12,093 | $129,362 | $25,291 | $104,071 |
| 2017 | $12,088 | $126,343 | $24,701 | $101,642 |
| 2016 | $11,954 | $122,011 | $23,854 | $98,157 |
| 2015 | $11,068 | $117,714 | $23,014 | $94,700 |
| 2014 | $11,068 | $116,896 | $22,854 | $94,042 |
| 2013 | $11,068 | $118,411 | $23,150 | $95,261 |
Source: Public Records
Map
Nearby Homes
- 8025 Stonegate Dr
- 8124 Glenbrook Place Unit 1
- 7959 Brookside Glen Dr Unit VI
- 8500 Brookside Glen Dr
- 8131 W Evergreen Dr
- 8026 Bradley Dr
- 7905 Richardson Ln
- 7928 Trinity Cir Unit 2SW
- 7928 Trinity Cir Unit 3NW
- 8607 Glenshire St
- 20027 S Jessica Ln
- 20158 S Rosewood Dr
- 19608 Ridgemont Dr
- 7716 Greenway Blvd Unit 1SW
- 7800 W Kingston Dr
- 7758 W Kingston Dr
- 191 S 88th Ave
- 19503 Tramore Ln
- 19502 Tramore Ln
- 20301 S Pine Hill Rd Unit 1D
- 8164 Cove Ct
- 8172 Cove Ct
- 19525 Glenbrook Ln
- 8154 Brookside Glen Dr
- 19531 Glenbrook Ln
- 19519 Glenbrook Ln
- 8160 Cove Ct
- 8200 Cove Ct
- 8148 Brookside Glen Dr
- 8169 Cove Ct
- 8168 Brookside Glen Dr
- 19537 Glenbrook Ln
- 19501 Glenbrook Ln
- 8142 Brookside Glen Dr Unit 4
- 8204 Cove Ct
- 19512 Glenbrook Ln
- 8173 Cove Ct
- 8172 Brookside Glen Dr
- 8101 Highfield Ct
- 8136 Brookside Glen Dr