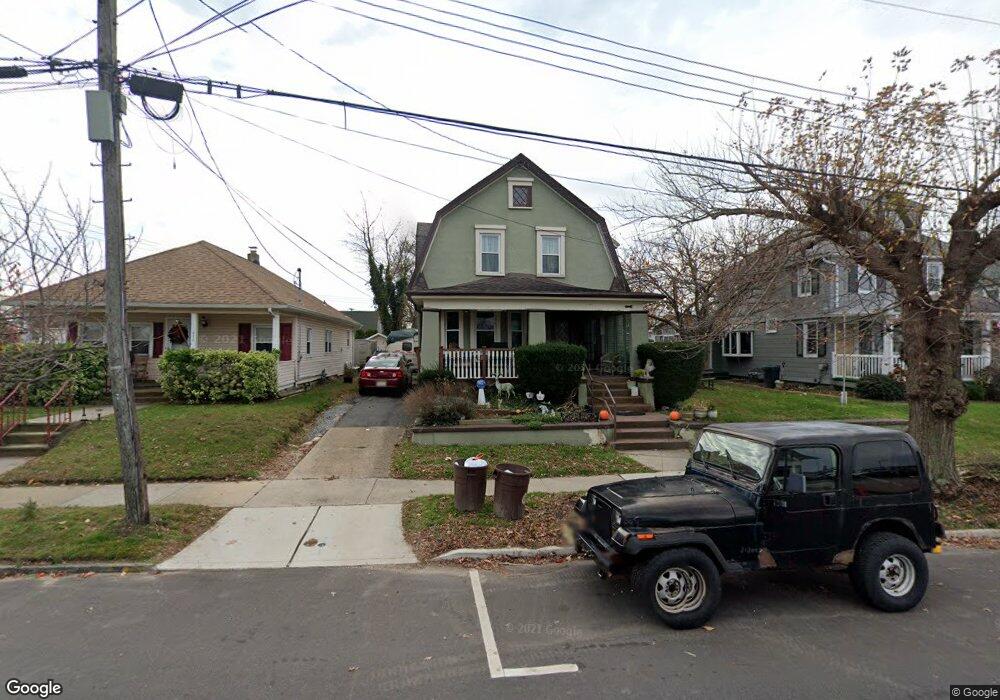
817 12th Ave Belmar, NJ 07719
Estimated Value: $668,000 - $1,126,000
3
Beds
2
Baths
1,728
Sq Ft
$517/Sq Ft
Est. Value
About This Home
This home is located at 817 12th Ave, Belmar, NJ 07719 and is currently estimated at $893,408, approximately $517 per square foot. 817 12th Ave is a home located in Monmouth County with nearby schools including Belmar Elementary School, St. Rose Grammar School, and St Rose High School.
Ownership History
Date
Name
Owned For
Owner Type
Purchase Details
Closed on
Nov 11, 2011
Sold by
Marola David
Bought by
Marola David and Marola Gene
Current Estimated Value
Purchase Details
Closed on
May 31, 2006
Sold by
Self Ann Teresa
Bought by
Marola David
Home Financials for this Owner
Home Financials are based on the most recent Mortgage that was taken out on this home.
Original Mortgage
$250,000
Interest Rate
8.5%
Mortgage Type
Adjustable Rate Mortgage/ARM
Create a Home Valuation Report for This Property
The Home Valuation Report is an in-depth analysis detailing your home's value as well as a comparison with similar homes in the area
Home Values in the Area
Average Home Value in this Area
Purchase History
| Date | Buyer | Sale Price | Title Company |
|---|---|---|---|
| Marola David | -- | Stewart Title Insurance Co | |
| Marola David | $625,000 | -- |
Source: Public Records
Mortgage History
| Date | Status | Borrower | Loan Amount |
|---|---|---|---|
| Previous Owner | Marola David | $250,000 |
Source: Public Records
Tax History Compared to Growth
Tax History
| Year | Tax Paid | Tax Assessment Tax Assessment Total Assessment is a certain percentage of the fair market value that is determined by local assessors to be the total taxable value of land and additions on the property. | Land | Improvement |
|---|---|---|---|---|
| 2025 | $7,320 | $503,100 | $280,000 | $223,100 |
| 2024 | $7,074 | $503,100 | $280,000 | $223,100 |
| 2023 | $7,074 | $503,100 | $280,000 | $223,100 |
| 2022 | $6,623 | $503,100 | $280,000 | $223,100 |
| 2021 | $6,623 | $503,100 | $280,000 | $223,100 |
| 2020 | $6,767 | $503,100 | $280,000 | $223,100 |
| 2019 | $6,767 | $503,100 | $280,000 | $223,100 |
| 2018 | $6,213 | $503,100 | $280,000 | $223,100 |
| 2017 | $6,062 | $503,100 | $280,000 | $223,100 |
| 2016 | $6,509 | $340,600 | $70,000 | $270,600 |
| 2015 | $6,632 | $345,600 | $75,000 | $270,600 |
| 2014 | $7,171 | $370,600 | $100,000 | $270,600 |
Source: Public Records
Map
Nearby Homes