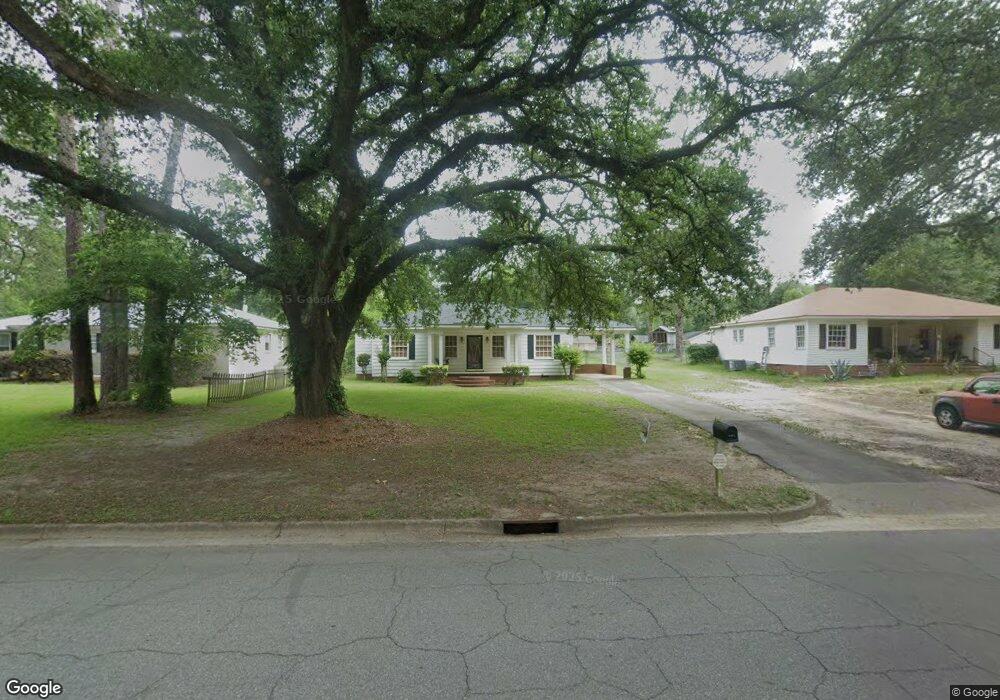
817 9th Ave Albany, GA 31701
Rawson Park NeighborhoodEstimated Value: $88,453 - $101,000
3
Beds
2
Baths
1,156
Sq Ft
$83/Sq Ft
Est. Value
About This Home
This home is located at 817 9th Ave, Albany, GA 31701 and is currently estimated at $95,613, approximately $82 per square foot. 817 9th Ave is a home located in Dougherty County with nearby schools including Northside Elementary School, Albany Middle School, and Albany High School.
Ownership History
Date
Name
Owned For
Owner Type
Purchase Details
Closed on
Oct 4, 2007
Sold by
Brown Edith Suzanne
Bought by
Wingfield Tracey L
Current Estimated Value
Home Financials for this Owner
Home Financials are based on the most recent Mortgage that was taken out on this home.
Original Mortgage
$94,319
Outstanding Balance
$59,590
Interest Rate
6.44%
Mortgage Type
FHA
Estimated Equity
$36,023
Purchase Details
Closed on
Mar 21, 2003
Sold by
Martin Alan R
Bought by
Brown Edith Suzanne
Purchase Details
Closed on
Feb 28, 2001
Sold by
Martin Russell E
Bought by
Martin Alan R
Purchase Details
Closed on
Mar 10, 1998
Sold by
Towery Robert Gordon By Exec U/Will
Bought by
Martin Alan R and Martin Russell E
Purchase Details
Closed on
Jan 30, 1987
Sold by
Towery Lydia Jan
Bought by
Towery Robert Gordon
Purchase Details
Closed on
May 3, 1982
Sold by
Towery Robert G
Bought by
Towery Lydia Jan
Create a Home Valuation Report for This Property
The Home Valuation Report is an in-depth analysis detailing your home's value as well as a comparison with similar homes in the area
Home Values in the Area
Average Home Value in this Area
Purchase History
| Date | Buyer | Sale Price | Title Company |
|---|---|---|---|
| Wingfield Tracey L | $95,800 | -- | |
| Brown Edith Suzanne | $54,000 | -- | |
| Martin Alan R | -- | -- | |
| Martin Alan R | $33,500 | -- | |
| Towery Robert Gordon | -- | -- | |
| Towery Lydia Jan | -- | -- |
Source: Public Records
Mortgage History
| Date | Status | Borrower | Loan Amount |
|---|---|---|---|
| Open | Wingfield Tracey L | $94,319 |
Source: Public Records
Tax History Compared to Growth
Tax History
| Year | Tax Paid | Tax Assessment Tax Assessment Total Assessment is a certain percentage of the fair market value that is determined by local assessors to be the total taxable value of land and additions on the property. | Land | Improvement |
|---|---|---|---|---|
| 2024 | $891 | $20,680 | $6,960 | $13,720 |
| 2023 | $32 | $20,680 | $6,960 | $13,720 |
| 2022 | $874 | $20,680 | $6,960 | $13,720 |
| 2021 | $810 | $20,680 | $6,960 | $13,720 |
| 2020 | $812 | $20,680 | $6,960 | $13,720 |
| 2019 | $680 | $20,680 | $6,960 | $13,720 |
| 2018 | $934 | $23,320 | $6,960 | $16,360 |
| 2017 | $870 | $23,320 | $6,960 | $16,360 |
| 2016 | $871 | $23,320 | $6,960 | $16,360 |
| 2015 | $873 | $23,320 | $6,960 | $16,360 |
| 2014 | $862 | $23,320 | $6,960 | $16,360 |
Source: Public Records
Map
Nearby Homes