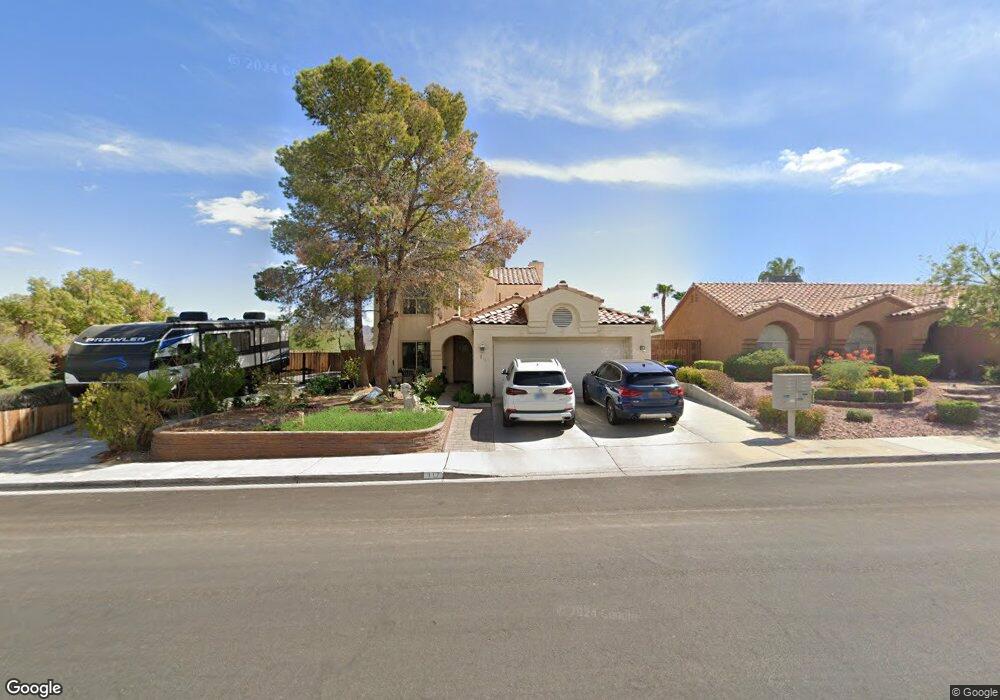
817 Arrowhead Trail Henderson, NV 89002
Highland Hills NeighborhoodEstimated Value: $457,000 - $495,000
3
Beds
3
Baths
1,962
Sq Ft
$243/Sq Ft
Est. Value
About This Home
This home is located at 817 Arrowhead Trail, Henderson, NV 89002 and is currently estimated at $476,086, approximately $242 per square foot. 817 Arrowhead Trail is a home located in Clark County with nearby schools including Fay Galloway Elementary School, Jack & Terry Mannion Middle School, and Foothill High School.
Ownership History
Date
Name
Owned For
Owner Type
Purchase Details
Closed on
Apr 3, 2025
Sold by
Hurtik Carrie E
Bought by
Vfplm Llc
Current Estimated Value
Purchase Details
Closed on
Feb 13, 2025
Sold by
Kaur Gurinder
Bought by
Lawrence N Sparks 2002 Trust and Kaur
Purchase Details
Closed on
Nov 21, 2024
Sold by
Ghuman Sarabjit Singh
Bought by
Kaur Gurinder
Purchase Details
Closed on
Nov 7, 2018
Sold by
Kaur Jahangir
Bought by
Ghuman Sarabjit Singh
Purchase Details
Closed on
Oct 18, 2007
Sold by
Kaur Gurinder
Bought by
Kaur Jahagir
Purchase Details
Closed on
Aug 13, 2007
Sold by
Henderson Pat E
Bought by
Kaur Gurinder and The Gurinder Kaur Family Trust
Purchase Details
Closed on
Mar 25, 2003
Sold by
Teravest Keldon W and Teravest Laurie J
Bought by
Kaur Gurinder
Home Financials for this Owner
Home Financials are based on the most recent Mortgage that was taken out on this home.
Original Mortgage
$175,500
Interest Rate
5.6%
Create a Home Valuation Report for This Property
The Home Valuation Report is an in-depth analysis detailing your home's value as well as a comparison with similar homes in the area
Home Values in the Area
Average Home Value in this Area
Purchase History
| Date | Buyer | Sale Price | Title Company |
|---|---|---|---|
| Vfplm Llc | $151,667 | None Listed On Document | |
| Lawrence N Sparks 2002 Trust | -- | None Listed On Document | |
| Kaur Gurinder | $278,226 | None Listed On Document | |
| Ghuman Sarabjit Singh | $203,486 | None Available | |
| Kaur Jahagir | -- | None Available | |
| Kaur Gurinder | -- | None Available | |
| Kaur Gurinder | $195,000 | Old Republic Title Company |
Source: Public Records
Mortgage History
| Date | Status | Borrower | Loan Amount |
|---|---|---|---|
| Previous Owner | Kaur Gurinder | $175,500 |
Source: Public Records
Tax History
| Year | Tax Paid | Tax Assessment Tax Assessment Total Assessment is a certain percentage of the fair market value that is determined by local assessors to be the total taxable value of land and additions on the property. | Land | Improvement |
|---|---|---|---|---|
| 2026 | $2,199 | $100,703 | $34,300 | $66,403 |
| 2025 | $2,135 | $95,569 | $26,950 | $68,619 |
| 2024 | $2,073 | $95,569 | $26,950 | $68,619 |
| 2023 | $2,073 | $99,427 | $33,950 | $65,477 |
| 2022 | $2,110 | $87,606 | $27,300 | $60,306 |
| 2021 | $1,954 | $80,402 | $22,750 | $57,652 |
| 2020 | $1,812 | $79,792 | $22,400 | $57,392 |
| 2019 | $1,698 | $76,656 | $19,950 | $56,706 |
| 2018 | $1,620 | $71,220 | $16,450 | $54,770 |
| 2017 | $2,044 | $70,525 | $14,700 | $55,825 |
| 2016 | $1,517 | $64,859 | $8,750 | $56,109 |
| 2015 | $1,513 | $54,325 | $8,750 | $45,575 |
| 2014 | $1,466 | $49,114 | $7,350 | $41,764 |
Source: Public Records
Map
Nearby Homes
- 836 Cherry Dr
- 936 Chaps Cir
- 713 Strawberry Place
- 818 Grape Vine Ave
- 945 Stetson Dr
- 951 High Plains Dr
- 785 Grape Vine Ave
- 599 Marsh Creek Ct Unit 3A
- 630 Bighorn Creek St
- 706 Morrocco Dr
- 963 High Plains Dr
- 0 College Dr
- 532 Big Lake St
- 540 Big Lake St
- 492 Waterfall Cove Ct
- 483 Waterfall Cove Ct
- 984 Mackenzie Creek Ave
- 542 Foothill Cove Ln
- 554 Foothill Cove Ln
- 718 Bighorn Creek St
- 818 Brahma Ln
- 821 Arrowhead Trail
- 818 Arrowhead Trail
- 816 Arrowhead Trail
- 820 Brahma Ln
- 817 Brahma Ln
- 820 Arrowhead Trail Unit 16
- 814 Arrowhead Trail
- 823 Arrowhead Trail
- 822 Arrowhead Trail
- 812 Arrowhead Trail
- 822 Brahma Ln
- 819 Cherry Dr
- 817 Cherry Dr
- 819 Brahma Ln
- 824 Arrowhead Trail
- 825 Arrowhead Trail
- 821 Cherry Dr
- 810 Arrowhead Trail
- 815 Cherry Dr
Your Personal Tour Guide
Ask me questions while you tour the home.