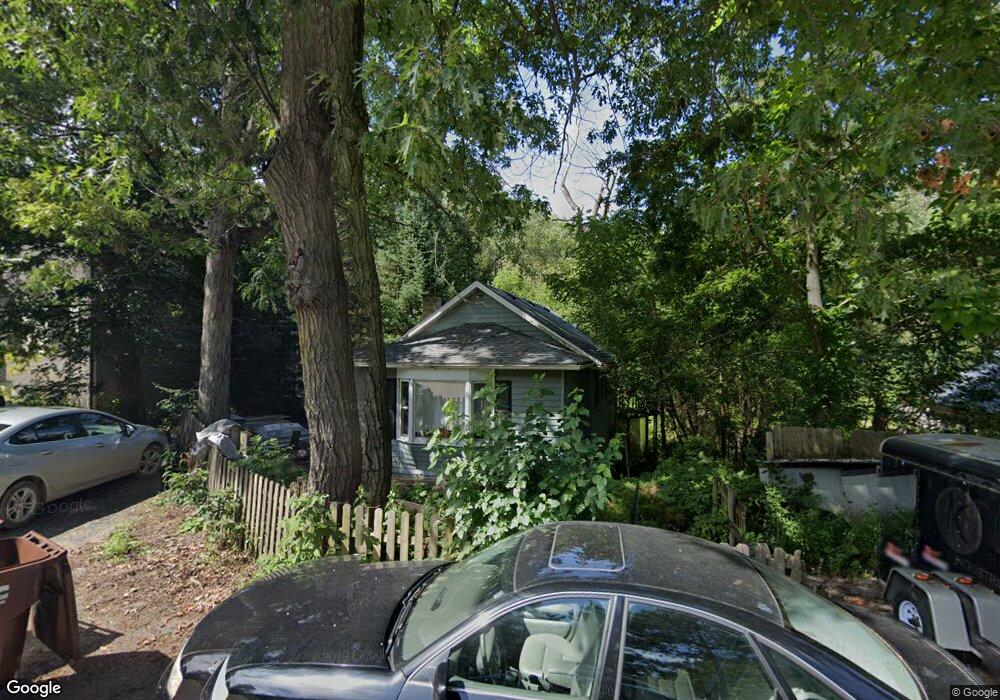
817 Black Partridge Rd McHenry, IL 60051
Emerald Park NeighborhoodEstimated Value: $209,000 - $282,000
3
Beds
4
Baths
704
Sq Ft
$346/Sq Ft
Est. Value
About This Home
This home is located at 817 Black Partridge Rd, McHenry, IL 60051 and is currently estimated at $243,307, approximately $345 per square foot. 817 Black Partridge Rd is a home located in McHenry County with nearby schools including Edgebrook Elementary School, Chauncey H Duker School, and Mchenry Middle School.
Ownership History
Date
Name
Owned For
Owner Type
Purchase Details
Closed on
May 30, 2002
Sold by
Townsend Bradley S
Bought by
Kranz Michele
Current Estimated Value
Home Financials for this Owner
Home Financials are based on the most recent Mortgage that was taken out on this home.
Original Mortgage
$109,000
Outstanding Balance
$46,283
Interest Rate
6.87%
Estimated Equity
$197,024
Purchase Details
Closed on
Aug 16, 1996
Sold by
Soos Victor C and Soos Rachel B
Bought by
Townsend Bradley S
Home Financials for this Owner
Home Financials are based on the most recent Mortgage that was taken out on this home.
Original Mortgage
$110,500
Interest Rate
8.18%
Purchase Details
Closed on
Sep 17, 1993
Sold by
Velcheck David C and Velcheck Cindy J
Bought by
Soos Victor C and Quarles Rachel B
Home Financials for this Owner
Home Financials are based on the most recent Mortgage that was taken out on this home.
Original Mortgage
$88,900
Interest Rate
6.62%
Create a Home Valuation Report for This Property
The Home Valuation Report is an in-depth analysis detailing your home's value as well as a comparison with similar homes in the area
Home Values in the Area
Average Home Value in this Area
Purchase History
| Date | Buyer | Sale Price | Title Company |
|---|---|---|---|
| Kranz Michele | $139,100 | -- | |
| Townsend Bradley S | $127,500 | Universal Title Services Inc | |
| Soos Victor C | $99,000 | -- |
Source: Public Records
Mortgage History
| Date | Status | Borrower | Loan Amount |
|---|---|---|---|
| Open | Kranz Michele | $109,000 | |
| Previous Owner | Townsend Bradley S | $110,500 | |
| Previous Owner | Soos Victor C | $88,900 |
Source: Public Records
Tax History Compared to Growth
Tax History
| Year | Tax Paid | Tax Assessment Tax Assessment Total Assessment is a certain percentage of the fair market value that is determined by local assessors to be the total taxable value of land and additions on the property. | Land | Improvement |
|---|---|---|---|---|
| 2024 | $4,260 | $61,540 | $11,657 | $49,883 |
| 2023 | $4,100 | $55,188 | $10,454 | $44,734 |
| 2022 | $3,968 | $50,469 | $9,560 | $40,909 |
| 2021 | $3,787 | $47,318 | $8,963 | $38,355 |
| 2020 | $3,747 | $45,899 | $8,694 | $37,205 |
| 2019 | $3,631 | $43,639 | $8,266 | $35,373 |
| 2018 | $3,759 | $40,991 | $7,764 | $33,227 |
| 2017 | $3,678 | $39,271 | $7,438 | $31,833 |
| 2016 | $3,604 | $37,469 | $7,097 | $30,372 |
| 2013 | -- | $35,659 | $6,754 | $28,905 |
Source: Public Records
Map
Nearby Homes
- 820 Black Partridge Rd
- 3000 Miller Dr
- 811 Carol Ave
- 3105 Still Hill Dr
- 0 S Broadway St
- 3205 W Vista Terrace
- 3203 Miller Dr
- 3207 Sunrise View St
- 1208 Hilltop Blvd
- 3500 Biscayne Rd
- 2810 Brentwood Ln
- 2624 Elm Oak Ln
- 3202 Turnberry Dr
- Lot 19-20-21 Valley Rd
- 3402 W Bretons Dr Unit 2
- 223 Barreville Rd
- 3510 Turnberry Dr
- 120 N Green St
- 1622 Conway Cir
- 702 S Il Route 31
- 815 Black Partridge Rd
- 2602 Indian Trail
- 2604 Indian Trail
- 807 Black Partridge Rd
- 2605 Indian Trail W
- 2610 Indian Trail
- 2605 Indian Trail
- 2601 Indian Trail
- 808 Black Partridge Rd
- 2607 Indian Trail
- 801 Black Partridge Rd
- 2609 Indian Trail
- 810 S Emerald Dr
- 2613 Pueblo Dr
- 2614 Indian Trail
- 816 Black Partridge Rd
- 806 S Emerald Dr
- 2701 Pueblo Dr
- 2613 Indian Trail
- 905 Osage Dr