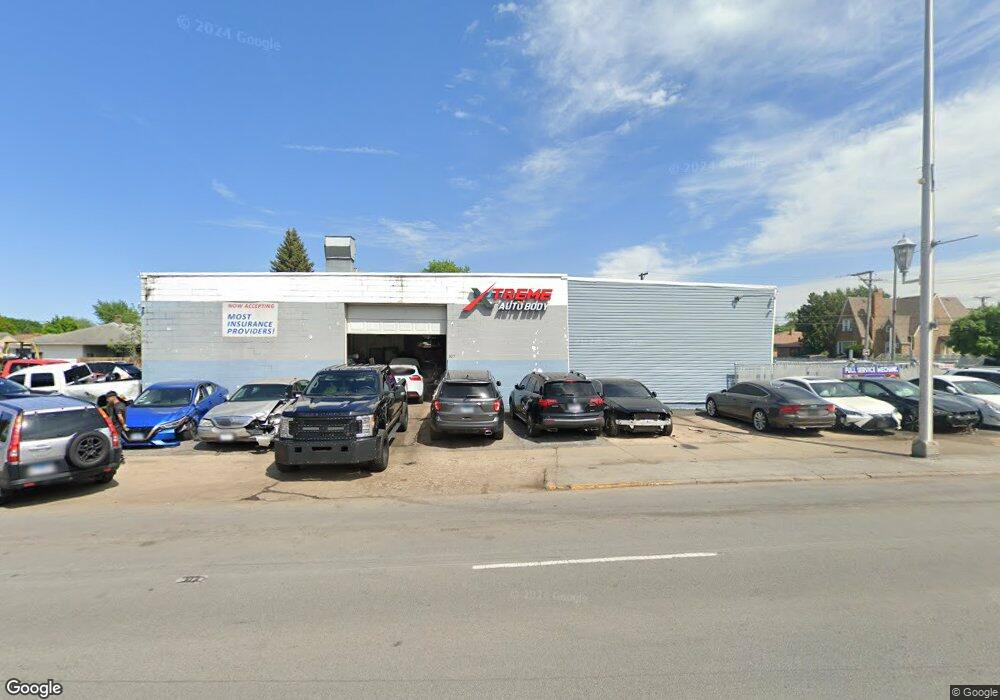
817 Burnham Ave Calumet City, IL 60409
--
Bed
--
Bath
5,000
Sq Ft
2,614
Sq Ft Lot
About This Home
This home is located at 817 Burnham Ave, Calumet City, IL 60409. 817 Burnham Ave is a home located in Cook County with nearby schools including Lincoln Elementary School, Thornton Fractional North High School, and Hammond Academy Of Science & Tech.
Ownership History
Date
Name
Owned For
Owner Type
Purchase Details
Closed on
May 29, 2024
Sold by
Al Hindi Ziyad A
Bought by
Canchola Esteban
Purchase Details
Closed on
Feb 21, 2017
Sold by
Equity Trust Co
Bought by
Ai Hindi Ziyad A
Purchase Details
Closed on
Dec 22, 2016
Sold by
Bayview Loan Servicing Llc
Bought by
Equity Trust Co and Ira Z085692
Purchase Details
Closed on
Dec 5, 2007
Sold by
Pineda Manuel Mendoza
Bought by
Boatner John and Sturdivant Tyrone
Home Financials for this Owner
Home Financials are based on the most recent Mortgage that was taken out on this home.
Original Mortgage
$200,000
Interest Rate
6.3%
Mortgage Type
Commercial
Purchase Details
Closed on
Nov 10, 2005
Sold by
Peters John L and Peters Linda C
Bought by
Pineda Manuel Mendoza
Home Financials for this Owner
Home Financials are based on the most recent Mortgage that was taken out on this home.
Original Mortgage
$179,000
Interest Rate
7.5%
Mortgage Type
Commercial
Create a Home Valuation Report for This Property
The Home Valuation Report is an in-depth analysis detailing your home's value as well as a comparison with similar homes in the area
Home Values in the Area
Average Home Value in this Area
Purchase History
| Date | Buyer | Sale Price | Title Company |
|---|---|---|---|
| Canchola Esteban | $200,000 | None Listed On Document | |
| Ai Hindi Ziyad A | $50,000 | None Available | |
| Equity Trust Co | $40,000 | Chicago Title | |
| Boatner John | $250,000 | First American Title | |
| Pineda Manuel Mendoza | $220,000 | Pntn |
Source: Public Records
Mortgage History
| Date | Status | Borrower | Loan Amount |
|---|---|---|---|
| Previous Owner | Boatner John | $200,000 | |
| Previous Owner | Pineda Manuel Mendoza | $179,000 |
Source: Public Records
Tax History Compared to Growth
Tax History
| Year | Tax Paid | Tax Assessment Tax Assessment Total Assessment is a certain percentage of the fair market value that is determined by local assessors to be the total taxable value of land and additions on the property. | Land | Improvement |
|---|---|---|---|---|
| 2024 | $9,158 | $16,559 | $2,250 | $14,309 |
| 2023 | $9,409 | $16,559 | $2,250 | $14,309 |
| 2022 | $9,409 | $12,997 | $4,875 | $8,122 |
| 2021 | $9,601 | $12,996 | $4,875 | $8,121 |
| 2020 | $8,953 | $12,996 | $4,875 | $8,121 |
| 2019 | $9,070 | $12,544 | $4,312 | $8,232 |
| 2018 | $8,939 | $12,544 | $4,312 | $8,232 |
| 2017 | $15,771 | $22,970 | $4,312 | $18,658 |
| 2016 | $17,591 | $27,203 | $3,937 | $23,266 |
| 2015 | $16,979 | $27,203 | $3,937 | $23,266 |
| 2014 | $16,965 | $27,203 | $3,937 | $23,266 |
| 2013 | $15,407 | $27,203 | $3,937 | $23,266 |
Source: Public Records
Map
Nearby Homes