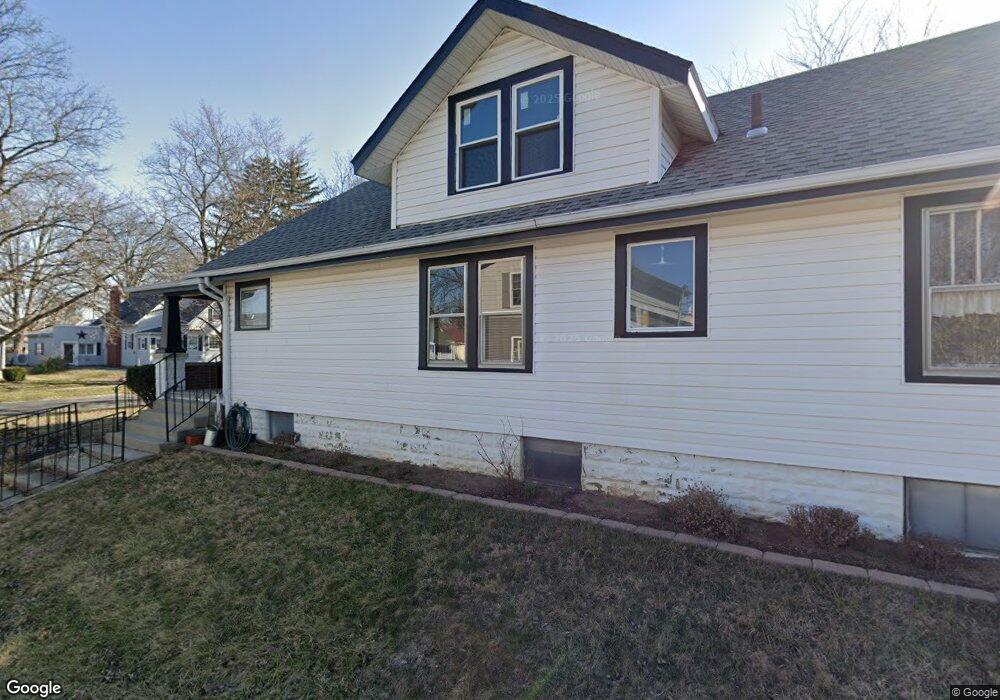
817 Cherry St Findlay, OH 45840
Estimated Value: $157,000 - $183,000
2
Beds
2
Baths
1,332
Sq Ft
$126/Sq Ft
Est. Value
About This Home
This home is located at 817 Cherry St, Findlay, OH 45840 and is currently estimated at $168,457, approximately $126 per square foot. 817 Cherry St is a home located in Hancock County with nearby schools including Whittier Elementary School, Wilson Vance Elementary School, and Donnell Middle School.
Ownership History
Date
Name
Owned For
Owner Type
Purchase Details
Closed on
Sep 1, 2020
Sold by
Haushalter Re Llc
Bought by
Padgett Welch Kelsey and Padgett Welch Jessica
Current Estimated Value
Home Financials for this Owner
Home Financials are based on the most recent Mortgage that was taken out on this home.
Original Mortgage
$129,900
Outstanding Balance
$114,450
Interest Rate
3%
Mortgage Type
New Conventional
Estimated Equity
$54,007
Purchase Details
Closed on
May 17, 2013
Sold by
Corbin Peggy Ann and Dysinger Terry Carl
Bought by
Haushalter Re Llc
Purchase Details
Closed on
Sep 21, 2005
Sold by
Dysinger Oletha K
Bought by
Corbin Peggy Ann and Dysinger Terry Carl
Purchase Details
Closed on
Feb 17, 1993
Bought by
Dysinger Carl E and Dysinger Oletha K
Purchase Details
Closed on
Jan 13, 1987
Bought by
Dysinger Carl E and Dysinger Oletha K
Purchase Details
Closed on
Jul 23, 1984
Bought by
Williams Retha
Create a Home Valuation Report for This Property
The Home Valuation Report is an in-depth analysis detailing your home's value as well as a comparison with similar homes in the area
Home Values in the Area
Average Home Value in this Area
Purchase History
| Date | Buyer | Sale Price | Title Company |
|---|---|---|---|
| Padgett Welch Kelsey | $145,000 | None Available | |
| Haushalter Re Llc | $86,000 | Mid Am Title Agency | |
| Corbin Peggy Ann | -- | -- | |
| Dysinger Carl E | -- | -- | |
| Dysinger Carl E | $38,000 | -- | |
| Williams Retha | -- | -- |
Source: Public Records
Mortgage History
| Date | Status | Borrower | Loan Amount |
|---|---|---|---|
| Open | Padgett Welch Kelsey | $129,900 |
Source: Public Records
Tax History
| Year | Tax Paid | Tax Assessment Tax Assessment Total Assessment is a certain percentage of the fair market value that is determined by local assessors to be the total taxable value of land and additions on the property. | Land | Improvement |
|---|---|---|---|---|
| 2024 | $1,542 | $43,410 | $5,180 | $38,230 |
| 2023 | $1,544 | $43,410 | $5,180 | $38,230 |
| 2022 | $1,539 | $43,410 | $5,180 | $38,230 |
| 2021 | $1,370 | $33,660 | $5,450 | $28,210 |
| 2020 | $1,370 | $33,660 | $5,450 | $28,210 |
| 2019 | $1,378 | $33,660 | $5,450 | $28,210 |
| 2018 | $1,310 | $29,350 | $4,740 | $24,610 |
| 2017 | $1,310 | $29,350 | $4,740 | $24,610 |
| 2016 | $1,301 | $29,350 | $4,740 | $24,610 |
| 2015 | $1,208 | $26,860 | $4,740 | $22,120 |
| 2014 | $1,208 | $26,860 | $4,740 | $22,120 |
| 2012 | $1,217 | $26,860 | $4,740 | $22,120 |
Source: Public Records
Map
Nearby Homes
- 439 Carnahan Ave
- 1020 Country Club Dr
- 640 Center St
- 655 Clinton Ct
- 810 Mcconnell St
- 523 Center St
- 741 Central Ave
- 1308 Greendale Ave
- 1125 Glen Meadow Dr
- 309 Huron Rd
- 1001 Decker Ave
- 1209 Heather Dr
- 623 E Sandusky St
- 1521 Middle Ct
- 912 Parkside Place
- 716 Winfield Ave
- 213 Cherry St
- 1421 E Sandusky St
- 125 Cherry St
- 207 Ash Ave
Your Personal Tour Guide
Ask me questions while you tour the home.