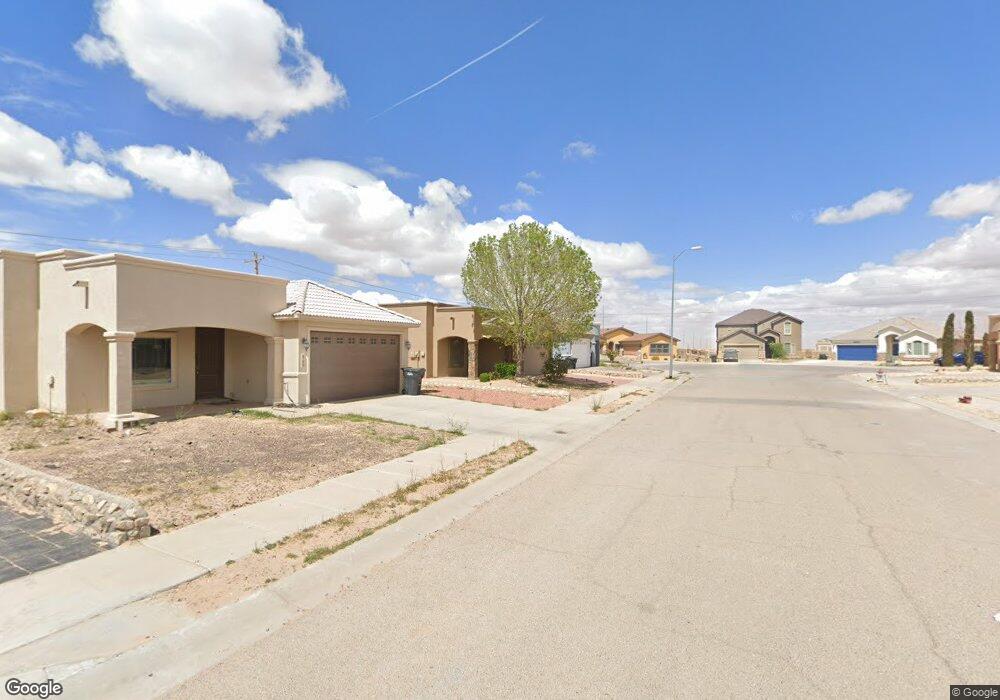
817 Desert Sky Dr Horizon City, TX 79928
Estimated Value: $210,000 - $222,000
3
Beds
2
Baths
1,348
Sq Ft
$162/Sq Ft
Est. Value
About This Home
This home is located at 817 Desert Sky Dr, Horizon City, TX 79928 and is currently estimated at $217,837, approximately $161 per square foot. 817 Desert Sky Dr is a home located in El Paso County with nearby schools including Desert Hills Elementary School, Horizon Middle School, and Horizon High School.
Ownership History
Date
Name
Owned For
Owner Type
Purchase Details
Closed on
Nov 16, 2023
Sold by
Silva Claudia M and Pratt Raoul F
Bought by
Pratt Raoul F
Current Estimated Value
Purchase Details
Closed on
Jun 2, 2021
Sold by
Fuente Robert De La and Defuente Rita De
Bought by
Pratt Raoul F and Silva Claudia M
Home Financials for this Owner
Home Financials are based on the most recent Mortgage that was taken out on this home.
Original Mortgage
$145,868
Interest Rate
2.9%
Mortgage Type
VA
Purchase Details
Closed on
Jan 20, 2016
Sold by
Dela Fuente Roberto
Bought by
Delafuente Roberto and Delafuente Rita
Purchase Details
Closed on
Sep 26, 2012
Sold by
Cimarron Mortgage Capital Llc
Bought by
Dela Fuente Roberto
Home Financials for this Owner
Home Financials are based on the most recent Mortgage that was taken out on this home.
Original Mortgage
$129,591
Interest Rate
3.7%
Mortgage Type
New Conventional
Create a Home Valuation Report for This Property
The Home Valuation Report is an in-depth analysis detailing your home's value as well as a comparison with similar homes in the area
Home Values in the Area
Average Home Value in this Area
Purchase History
| Date | Buyer | Sale Price | Title Company |
|---|---|---|---|
| Pratt Raoul F | -- | None Listed On Document | |
| Pratt Raoul F | -- | None Available | |
| Delafuente Roberto | -- | None Available | |
| Dela Fuente Roberto | -- | None Available |
Source: Public Records
Mortgage History
| Date | Status | Borrower | Loan Amount |
|---|---|---|---|
| Previous Owner | Pratt Raoul F | $145,868 | |
| Previous Owner | Dela Fuente Roberto | $129,591 |
Source: Public Records
Tax History Compared to Growth
Tax History
| Year | Tax Paid | Tax Assessment Tax Assessment Total Assessment is a certain percentage of the fair market value that is determined by local assessors to be the total taxable value of land and additions on the property. | Land | Improvement |
|---|---|---|---|---|
| 2025 | $5,203 | $217,853 | -- | -- |
| 2024 | $5,203 | $198,048 | -- | -- |
| 2023 | $4,533 | $180,044 | $0 | $0 |
| 2022 | $5,307 | $163,676 | $0 | $0 |
| 2021 | $5,310 | $148,796 | $22,692 | $126,104 |
| 2020 | $4,934 | $142,044 | $22,692 | $119,352 |
| 2018 | $4,574 | $143,434 | $22,692 | $120,742 |
| 2017 | $4,114 | $132,373 | $22,692 | $109,681 |
| 2016 | $3,740 | $112,630 | $22,692 | $89,938 |
| 2015 | $3,751 | $112,630 | $22,692 | $89,938 |
| 2014 | $3,751 | $118,709 | $22,692 | $96,017 |
Source: Public Records
Map
Nearby Homes
- 952 Sandhurst Place
- 13973 Lorenz Ave
- 933 Sandhurst Place
- 920 Sandhurst Place
- 816 Desert Moon Dr
- 916 Sandhurst Place
- 916 Summer Lake St
- 13949 Lorenz Ave
- 13945 Lorenz Ave
- 1025 Summer Lake St
- 1033 Summer Lake St
- 1048 Summer Lake St
- 1041 Summer Lake St
- Adam Plan at Summer Sky - North
- Mesilla Plan at Summer Sky - North
- Madison Plan at Summer Sky - North
- Ivy Plan at Summer Sky - North
- Briante Plan at Summer Sky - North
- Acoma Plan at Summer Sky - North
- Kate Plan at Summer Sky - North
- 813 Desert Sky Dr
- 821 Desert Sky Dr
- 1267 Desert Sky Dr
- 7108 Desert Sky Dr
- 7112 Desert Sky Dr
- 7116 Desert Sky Dr
- 7120 Desert Sky Dr
- 7161 Desert Sky Dr
- 7157 Desert Sky Dr
- 7169 Desert Sky Dr
- 7165 Desert Sky Dr
- 7173 Desert Sky Dr
- 809 Desert Sky Dr
- 825 Desert Sky Dr
- 805 Desert Sky Dr
- 812 Desert Sky Dr
- 808 Desert Sky Dr
- 824 Desert Sky Dr
- 804 Desert Sky Dr
- 816 Desert Sky Dr