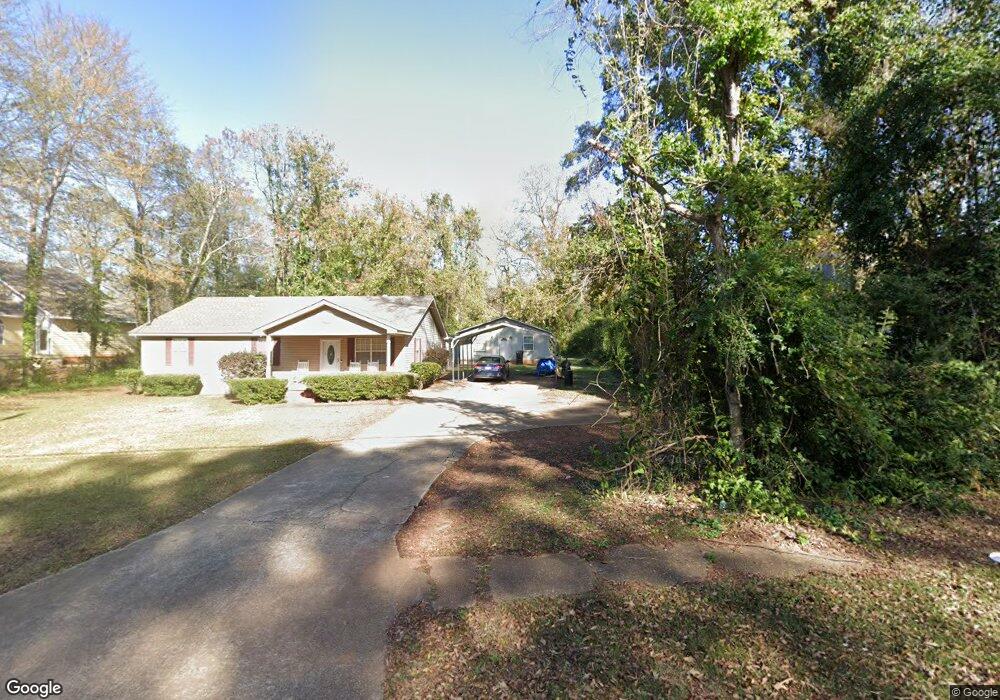
817 E 6th St West Point, GA 31833
Estimated Value: $149,000 - $205,000
3
Beds
2
Baths
1,664
Sq Ft
$101/Sq Ft
Est. Value
About This Home
This home is located at 817 E 6th St, West Point, GA 31833 and is currently estimated at $168,437, approximately $101 per square foot. 817 E 6th St is a home located in Troup County with nearby schools including West Point Elementary School, Long Cane Elementary School, and Whitesville Road Elementary School.
Ownership History
Date
Name
Owned For
Owner Type
Purchase Details
Closed on
Aug 20, 1999
Sold by
Pete Bryan W W
Bought by
Wilson Lavone
Current Estimated Value
Purchase Details
Closed on
Jun 15, 1999
Sold by
Pete Bryan W W
Bought by
Pete Bryan W W
Purchase Details
Closed on
Jul 5, 1993
Sold by
Anthony D Matheny
Bought by
Pete Bryan W W
Purchase Details
Closed on
Jan 24, 1992
Sold by
Stribling Phillip E
Bought by
Anthony D Matheny
Purchase Details
Closed on
Dec 15, 1989
Sold by
Pearl C Harrell
Bought by
Stribling Phillip E
Purchase Details
Closed on
Oct 6, 1989
Sold by
Roy Fred and Roy Davidson
Bought by
Pearl C Harrell
Purchase Details
Closed on
Nov 1, 1987
Sold by
Pearl C Harrell
Bought by
Roy Fred and Roy Davidson
Purchase Details
Closed on
Mar 1, 1987
Sold by
Frank Roy C and Frank Harrell
Bought by
Pearl C Harrell
Purchase Details
Closed on
Jan 1, 1919
Sold by
Wallace J W
Bought by
Frank Roy C and Frank Harrell
Create a Home Valuation Report for This Property
The Home Valuation Report is an in-depth analysis detailing your home's value as well as a comparison with similar homes in the area
Home Values in the Area
Average Home Value in this Area
Purchase History
| Date | Buyer | Sale Price | Title Company |
|---|---|---|---|
| Wilson Lavone | -- | -- | |
| Pete Bryan W W | $2,500 | -- | |
| Pete Bryan W W | -- | -- | |
| Anthony D Matheny | -- | -- | |
| Stribling Phillip E | -- | -- | |
| Pearl C Harrell | -- | -- | |
| Roy Fred | -- | -- | |
| Pearl C Harrell | -- | -- | |
| Frank Roy C | -- | -- |
Source: Public Records
Tax History
| Year | Tax Paid | Tax Assessment Tax Assessment Total Assessment is a certain percentage of the fair market value that is determined by local assessors to be the total taxable value of land and additions on the property. | Land | Improvement |
|---|---|---|---|---|
| 2025 | $1,153 | $60,064 | $4,920 | $55,144 |
| 2024 | $965 | $48,004 | $4,920 | $43,084 |
| 2023 | $265 | $48,452 | $4,920 | $43,532 |
| 2022 | $542 | $45,812 | $4,920 | $40,892 |
| 2021 | $515 | $43,580 | $4,920 | $38,660 |
| 2020 | $1,113 | $38,880 | $1,800 | $37,080 |
| 2019 | $1,082 | $37,880 | $1,800 | $36,080 |
| 2018 | $1,031 | $36,160 | $1,800 | $34,360 |
| 2017 | $1,031 | $36,160 | $1,800 | $34,360 |
| 2016 | $1,019 | $35,768 | $1,800 | $33,968 |
| 2015 | $1,021 | $35,768 | $1,800 | $33,968 |
| 2014 | $968 | $33,980 | $1,800 | $32,180 |
| 2013 | -- | $36,196 | $1,800 | $34,396 |
Source: Public Records
Map
Nearby Homes
- 509 Cleveland St
- 707 E 7th St
- 1104 E 8th St
- 506 E 6th St
- 0 Arrowhead Dr Unit 10451860
- 900 E 9th St
- 1202 E 9th St
- 112 Hillcrest Rd
- 1418 E 10th St
- 128 Highland Dr
- 0 Sunset Dr Unit 10451831
- 712 4th Ave
- 1007 4th Ave
- 1026 N 6th Ave
- 403 N 15th St
- 1508 N 4th Ave
- 302 N 6th Ave
- 514 N 8th Ave
- 4517 Georgia 18
- 4509 Georgia 18
Your Personal Tour Guide
Ask me questions while you tour the home.