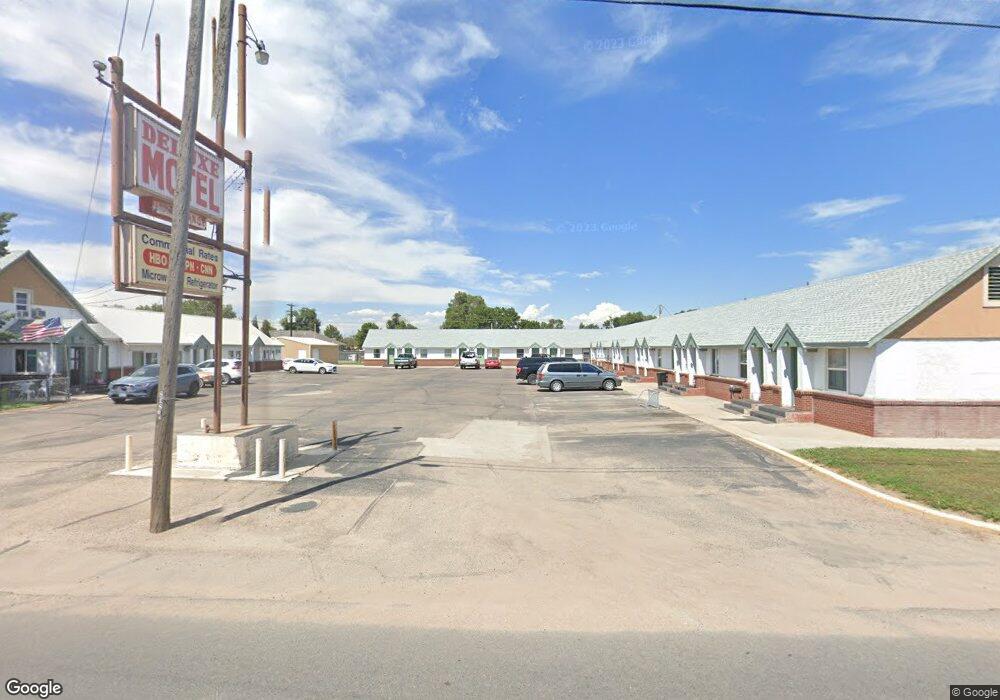
817 E Platte Ave Fort Morgan, CO 80701
Estimated Value: $769,791 - $1,975,000
3
Beds
2
Baths
10,735
Sq Ft
$119/Sq Ft
Est. Value
About This Home
This home is located at 817 E Platte Ave, Fort Morgan, CO 80701 and is currently estimated at $1,280,198, approximately $119 per square foot. 817 E Platte Ave is a home located in Morgan County with nearby schools including Fort Morgan High School, Trinity Lutheran School, and Lighthouse Seventh-day Adventist Christian School.
Ownership History
Date
Name
Owned For
Owner Type
Purchase Details
Closed on
Oct 27, 2008
Sold by
Jsm Hospitality Inc
Bought by
Son N Sun Llc
Current Estimated Value
Home Financials for this Owner
Home Financials are based on the most recent Mortgage that was taken out on this home.
Original Mortgage
$280,000
Outstanding Balance
$183,070
Interest Rate
6%
Mortgage Type
Future Advance Clause Open End Mortgage
Estimated Equity
$1,097,128
Create a Home Valuation Report for This Property
The Home Valuation Report is an in-depth analysis detailing your home's value as well as a comparison with similar homes in the area
Home Values in the Area
Average Home Value in this Area
Purchase History
| Date | Buyer | Sale Price | Title Company |
|---|---|---|---|
| Son N Sun Llc | $400,000 | None Available |
Source: Public Records
Mortgage History
| Date | Status | Borrower | Loan Amount |
|---|---|---|---|
| Open | Son N Sun Llc | $280,000 |
Source: Public Records
Tax History Compared to Growth
Tax History
| Year | Tax Paid | Tax Assessment Tax Assessment Total Assessment is a certain percentage of the fair market value that is determined by local assessors to be the total taxable value of land and additions on the property. | Land | Improvement |
|---|---|---|---|---|
| 2024 | $12,111 | $151,260 | $32,620 | $118,640 |
| 2023 | $12,111 | $162,380 | $33,270 | $129,110 |
| 2022 | $9,030 | $110,170 | $34,570 | $75,600 |
| 2021 | $9,108 | $111,000 | $34,770 | $76,230 |
| 2020 | $9,294 | $110,220 | $34,770 | $75,450 |
| 2019 | $9,308 | $110,220 | $34,770 | $75,450 |
| 2018 | $6,943 | $81,020 | $32,230 | $48,790 |
| 2017 | $6,950 | $81,020 | $32,230 | $48,790 |
| 2016 | $5,776 | $66,710 | $30,720 | $35,990 |
| 2015 | $5,693 | $66,710 | $30,720 | $35,990 |
| 2014 | $5,496 | $62,810 | $29,840 | $32,970 |
| 2013 | -- | $62,810 | $29,840 | $32,970 |
Source: Public Records
Map
Nearby Homes