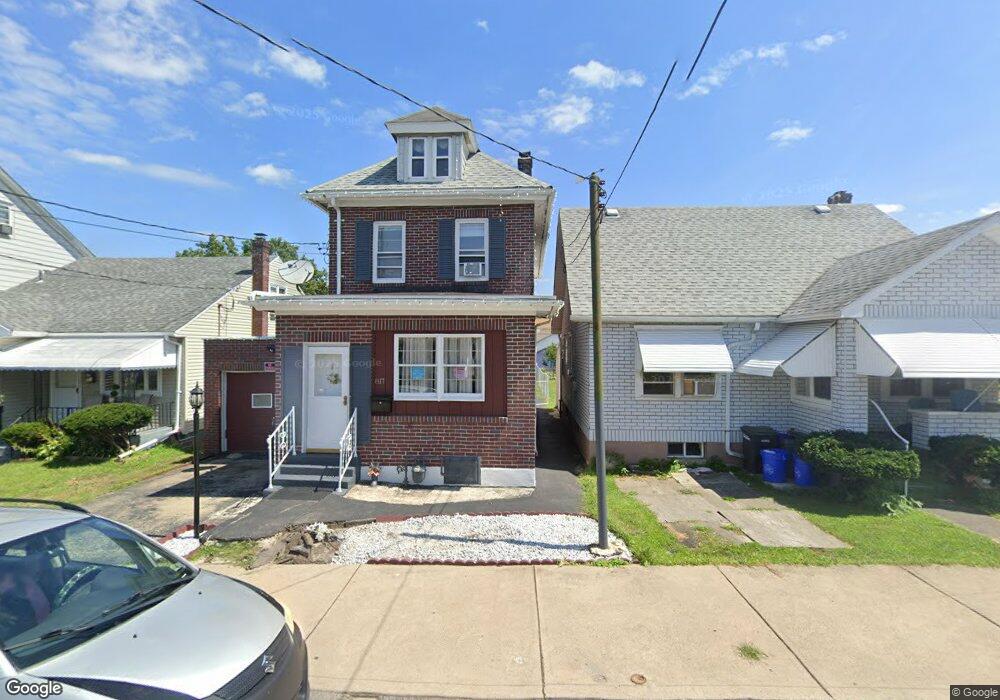
817 Grant St Hazleton, PA 18201
Estimated Value: $231,208 - $261,000
3
Beds
1
Bath
1,993
Sq Ft
$126/Sq Ft
Est. Value
About This Home
This home is located at 817 Grant St, Hazleton, PA 18201 and is currently estimated at $250,302, approximately $125 per square foot. 817 Grant St is a home located in Luzerne County with nearby schools including Hazleton Area High School, Immanuel Christian School, and Bishop Hafey Junior/Senior High School.
Ownership History
Date
Name
Owned For
Owner Type
Purchase Details
Closed on
Oct 12, 2021
Sold by
Hodgson Terry D
Bought by
Polanco Francia Cabera
Current Estimated Value
Home Financials for this Owner
Home Financials are based on the most recent Mortgage that was taken out on this home.
Original Mortgage
$179,450
Outstanding Balance
$161,856
Interest Rate
2.8%
Mortgage Type
New Conventional
Estimated Equity
$88,446
Purchase Details
Closed on
Sep 25, 2017
Sold by
Hodgson John G
Bought by
Hodgson John G and Hodgson Terry D
Purchase Details
Closed on
Jan 1, 1960
Bought by
Hodgson John G Ux Betty R
Create a Home Valuation Report for This Property
The Home Valuation Report is an in-depth analysis detailing your home's value as well as a comparison with similar homes in the area
Home Values in the Area
Average Home Value in this Area
Purchase History
| Date | Buyer | Sale Price | Title Company |
|---|---|---|---|
| Polanco Francia Cabera | $185,000 | Toma Abstract Inc | |
| Hodgson John G | -- | None Available | |
| Hodgson John G Ux Betty R | -- | -- |
Source: Public Records
Mortgage History
| Date | Status | Borrower | Loan Amount |
|---|---|---|---|
| Open | Polanco Francia Cabera | $179,450 |
Source: Public Records
Tax History
| Year | Tax Paid | Tax Assessment Tax Assessment Total Assessment is a certain percentage of the fair market value that is determined by local assessors to be the total taxable value of land and additions on the property. | Land | Improvement |
|---|---|---|---|---|
| 2026 | $2,374 | $115,600 | $23,800 | $91,800 |
| 2025 | $3,321 | $115,600 | $23,800 | $91,800 |
| 2024 | $3,111 | $115,600 | $23,800 | $91,800 |
| 2023 | $2,908 | $115,600 | $23,800 | $91,800 |
| 2022 | $2,887 | $115,600 | $23,800 | $91,800 |
| 2021 | $2,820 | $115,600 | $23,800 | $91,800 |
| 2020 | $2,520 | $115,600 | $23,800 | $91,800 |
| 2019 | $2,600 | $115,600 | $23,800 | $91,800 |
| 2018 | $2,512 | $115,600 | $23,800 | $91,800 |
| 2017 | $2,315 | $115,600 | $23,800 | $91,800 |
| 2016 | $1,261 | $115,600 | $23,800 | $91,800 |
| 2015 | $1,229 | $115,600 | $23,800 | $91,800 |
| 2014 | $1,229 | $115,600 | $23,800 | $91,800 |
Source: Public Records
Map
Nearby Homes
- 829 W 21st St
- 897 N Vine St
- 403 W 7th St
- 60 E Jefferson Ave
- 1087 Lafayette Ct
- 0 Church Unit PALU2002778
- 118 E Green St
- 1 W Diamond Ave
- 14 W 4th St
- 127 W Diamond Ave
- 187 N Church St
- 360 W Spruce St
- 756 Seybert St
- 218 North St
- 911 Seybert St
- 239 Lincalis St
- ER.126 W Aspen St
- 991 Seybert St
- 116 N Laurel St
- 397 W 30th St
Your Personal Tour Guide
Ask me questions while you tour the home.