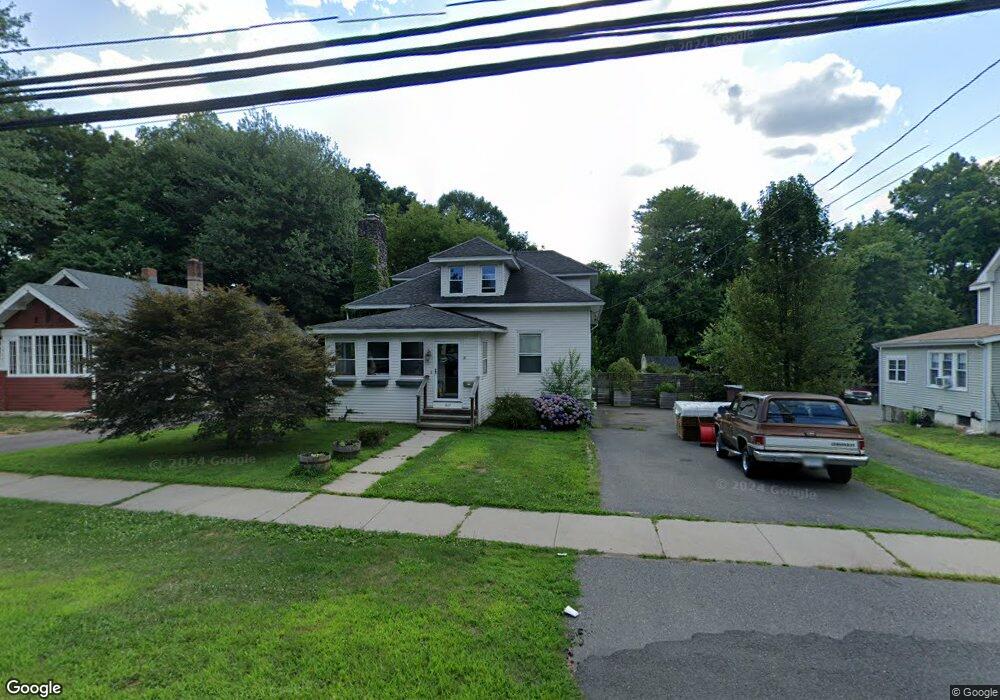
817 Main St Newington, CT 06111
Estimated Value: $299,000 - $386,000
4
Beds
1
Bath
1,977
Sq Ft
$178/Sq Ft
Est. Value
About This Home
This home is located at 817 Main St, Newington, CT 06111 and is currently estimated at $352,740, approximately $178 per square foot. 817 Main St is a home located in Hartford County with nearby schools including Elizabeth Green School, Martin Kellogg Middle School, and Newington High School.
Ownership History
Date
Name
Owned For
Owner Type
Purchase Details
Closed on
May 27, 2020
Sold by
Larson Julie
Bought by
Larson Robert E and Larson Julie V
Current Estimated Value
Home Financials for this Owner
Home Financials are based on the most recent Mortgage that was taken out on this home.
Original Mortgage
$153,700
Outstanding Balance
$104,088
Interest Rate
3.2%
Mortgage Type
New Conventional
Estimated Equity
$248,652
Purchase Details
Closed on
Mar 15, 2011
Sold by
Campbell Michael and Campbell Laura J
Bought by
Larson Julie
Home Financials for this Owner
Home Financials are based on the most recent Mortgage that was taken out on this home.
Original Mortgage
$161,600
Interest Rate
4.25%
Mortgage Type
FHA
Purchase Details
Closed on
Jul 22, 2010
Sold by
Us Bk
Bought by
Campbell Michael and Campbell Laura L
Purchase Details
Closed on
Mar 16, 2009
Sold by
Morales Andrea and Us Bank Na
Bought by
Us Bank Na
Purchase Details
Closed on
Dec 17, 2001
Sold by
Bennett Jeni K
Bought by
Morales Andrea
Create a Home Valuation Report for This Property
The Home Valuation Report is an in-depth analysis detailing your home's value as well as a comparison with similar homes in the area
Home Values in the Area
Average Home Value in this Area
Purchase History
| Date | Buyer | Sale Price | Title Company |
|---|---|---|---|
| Larson Robert E | -- | None Available | |
| Larson Julie | $174,000 | -- | |
| Campbell Michael | $129,900 | -- | |
| Us Bk | -- | -- | |
| Us Bank Na | -- | -- | |
| Morales Andrea | $106,000 | -- |
Source: Public Records
Mortgage History
| Date | Status | Borrower | Loan Amount |
|---|---|---|---|
| Open | Larson Robert E | $153,700 | |
| Previous Owner | Morales Andrea | $164,000 | |
| Previous Owner | Morales Andrea | $161,600 |
Source: Public Records
Tax History
| Year | Tax Paid | Tax Assessment Tax Assessment Total Assessment is a certain percentage of the fair market value that is determined by local assessors to be the total taxable value of land and additions on the property. | Land | Improvement |
|---|---|---|---|---|
| 2025 | $5,426 | $135,710 | $55,690 | $80,020 |
| 2024 | $5,384 | $135,710 | $55,690 | $80,020 |
| 2023 | $5,206 | $135,710 | $55,690 | $80,020 |
| 2022 | $5,223 | $135,710 | $55,690 | $80,020 |
| 2021 | $5,267 | $135,710 | $55,690 | $80,020 |
| 2020 | $5,268 | $134,120 | $53,550 | $80,570 |
| 2019 | $5,291 | $134,120 | $53,550 | $80,570 |
| 2018 | $5,164 | $134,120 | $53,550 | $80,570 |
| 2017 | $4,907 | $134,120 | $53,550 | $80,570 |
| 2016 | $4,795 | $134,120 | $53,550 | $80,570 |
| 2014 | $4,444 | $127,800 | $53,330 | $74,470 |
Source: Public Records
Map
Nearby Homes
- 140 Dowd St
- 42 Sunset Rd
- 38 Northwood Rd
- 70 Woodland St
- 73 Coolidge Ave
- 27 Harding Ave
- 82 Millbrook Ct
- 1 Old Farm Dr
- 9 Old Farm Dr
- 7 Old Farm Dr
- 177 Moylan Ct Unit 177
- 33 Cedar Ridge Rd
- 274 Cedarwood Ln
- 79 Piper Brook Ave
- 131 Williamstown Ct Unit 131
- 138 Williamstown Ct Unit 138
- 236 Old Farm Dr
- 22 Mohawk Cir
- 263 Williamstown Ct
- 25 Dacosta Dr Unit 25
Your Personal Tour Guide
Ask me questions while you tour the home.