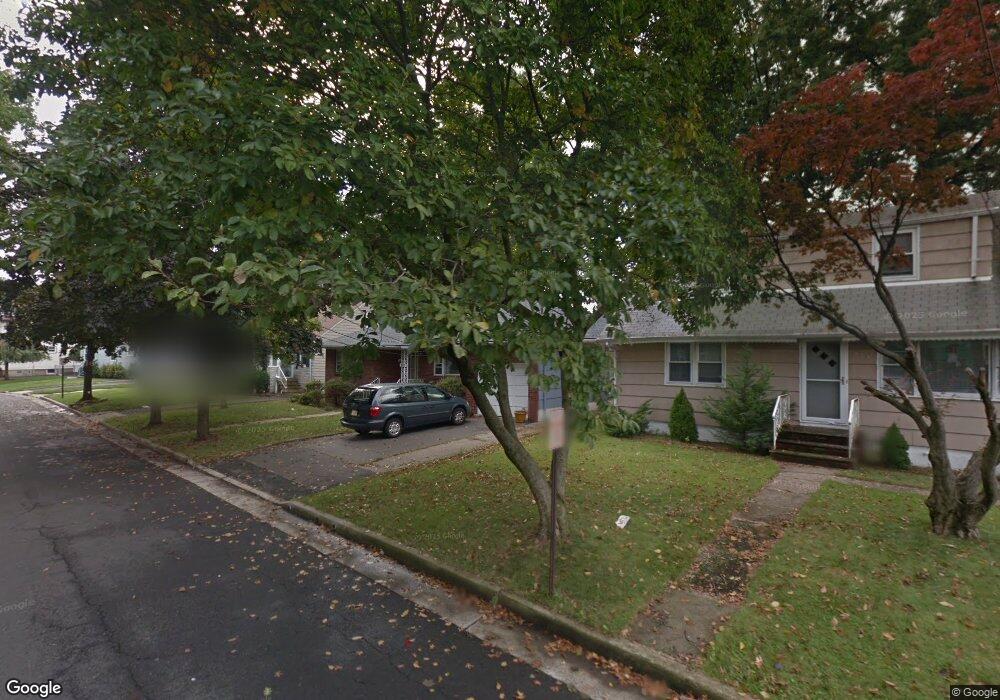
817 Maple Ave Linden, NJ 07036
Estimated Value: $449,431 - $508,000
Studio
--
Bath
1,162
Sq Ft
$418/Sq Ft
Est. Value
About This Home
This home is located at 817 Maple Ave, Linden, NJ 07036 and is currently estimated at $485,608, approximately $417 per square foot. 817 Maple Ave is a home located in Union County with nearby schools including Number 1, Joseph E. Soehl Middle School, and Linden High School.
Ownership History
Date
Name
Owned For
Owner Type
Purchase Details
Closed on
Sep 25, 1995
Sold by
Betts Daniel and Betts Barbara
Bought by
Fernandes Antonio F and Fernandes Miguelina S
Current Estimated Value
Purchase Details
Closed on
Nov 18, 1993
Sold by
Langbehn Debra A
Bought by
Betts Daniel and Betts Barbara
Home Financials for this Owner
Home Financials are based on the most recent Mortgage that was taken out on this home.
Original Mortgage
$90,000
Interest Rate
7.03%
Create a Home Valuation Report for This Property
The Home Valuation Report is an in-depth analysis detailing your home's value as well as a comparison with similar homes in the area
Home Values in the Area
Average Home Value in this Area
Purchase History
| Date | Buyer | Sale Price | Title Company |
|---|---|---|---|
| Fernandes Antonio F | $135,000 | -- | |
| Betts Daniel | $135,000 | -- |
Source: Public Records
Mortgage History
| Date | Status | Borrower | Loan Amount |
|---|---|---|---|
| Previous Owner | Betts Daniel | $90,000 |
Source: Public Records
Tax History
| Year | Tax Paid | Tax Assessment Tax Assessment Total Assessment is a certain percentage of the fair market value that is determined by local assessors to be the total taxable value of land and additions on the property. | Land | Improvement |
|---|---|---|---|---|
| 2025 | $8,242 | $117,200 | $50,000 | $67,200 |
| 2024 | $8,061 | $117,200 | $50,000 | $67,200 |
| 2023 | $8,061 | $117,200 | $50,000 | $67,200 |
| 2022 | $8,103 | $117,200 | $50,000 | $67,200 |
| 2021 | $8,144 | $117,200 | $50,000 | $67,200 |
| 2020 | $8,101 | $117,200 | $50,000 | $67,200 |
| 2019 | $8,074 | $117,200 | $50,000 | $67,200 |
| 2018 | $8,072 | $117,200 | $50,000 | $67,200 |
| 2017 | $9,662 | $143,400 | $54,000 | $89,400 |
| 2016 | $9,358 | $143,400 | $54,000 | $89,400 |
| 2015 | $9,001 | $143,400 | $54,000 | $89,400 |
| 2014 | $8,826 | $143,400 | $54,000 | $89,400 |
Source: Public Records
Map
Nearby Homes
- 724 Walnut St
- 812 Washington Ave
- 620 Jackson Ave
- 113 E Curtis St
- 909 Seymour Ave
- 721 E Curtis St
- 539 Monmouth Ave
- 918 Bower St
- 914 Bower St
- 229 Hillcrest Terrace
- 534 Monmouth Ave
- 609 Harrison Place
- 725 N Wood Ave
- 811 Jackson Ave
- 215 Victory St
- 825 Jackson Ave
- 100 Luttgen Place Unit A2
- 142 Bonna Villa Ave
- 830 E Curtis St
- 3 Fern St
Your Personal Tour Guide
Ask me questions while you tour the home.