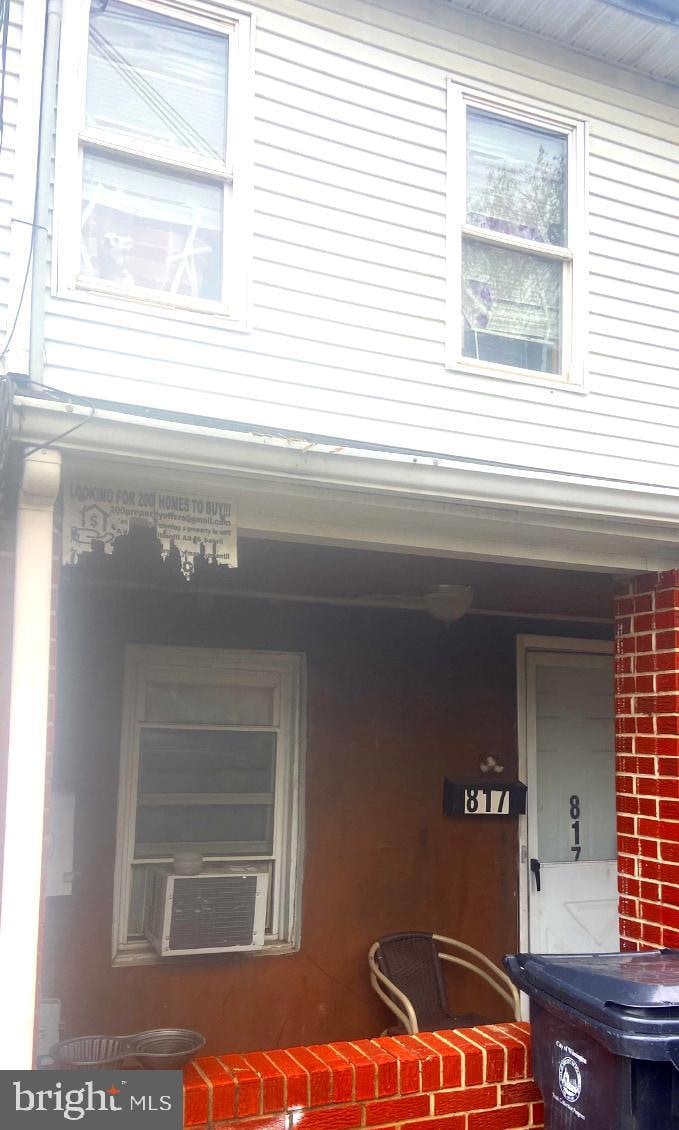
817 Marshall St Wilmington, DE 19805
Browntown NeighborhoodEstimated payment $668/month
Highlights
- No HOA
- Living Room
- Dining Room
- Cooling Available
About This Home
Investor Alert! Long term tenant, would like to stay. 2 bedroom 1 bath in Brown town Wilmington DE.
Listing Agent
(302) 442-4200 jessicastiner@remax.net RE/MAX Edge Brokerage Phone: 3024424200 License #RS364323 Listed on: 12/03/2025
Townhouse Details
Home Type
- Townhome
Est. Annual Taxes
- $575
Year Built
- Built in 1906
Lot Details
- 871 Sq Ft Lot
Home Design
- Vinyl Siding
- Concrete Perimeter Foundation
Interior Spaces
- 1,100 Sq Ft Home
- Property has 1 Level
- Living Room
- Dining Room
Bedrooms and Bathrooms
- 2 Bedrooms
- 1 Full Bathroom
Utilities
- Cooling Available
- Heating System Uses Natural Gas
Community Details
- No Home Owners Association
- Wilm #01 Subdivision
Listing and Financial Details
- Assessor Parcel Number 26-042.30-241
Map
Home Values in the Area
Average Home Value in this Area
Tax History
We collect this data history from publicly available records. To have your information removed, we recommend requesting removal directly through your county’s website.
| Year | Tax Paid | Tax Assessment Tax Assessment Total Assessment is a certain percentage of the fair market value that is determined by local assessors to be the total taxable value of land and additions on the property. | Land | Improvement |
|---|---|---|---|---|
| 2025 | $613 | $88,100 | $30,000 | $58,100 |
| 2024 | $453 | $12,300 | $2,400 | $9,900 |
| 2023 | $442 | $12,300 | $2,400 | $9,900 |
| 2022 | $438 | $12,300 | $2,400 | $9,900 |
| 2021 | $426 | $12,300 | $2,400 | $9,900 |
| 2020 | $414 | $12,300 | $2,400 | $9,900 |
| 2019 | $245 | $12,300 | $2,400 | $9,900 |
| 2018 | $34 | $12,300 | $2,400 | $9,900 |
| 2017 | $570 | $12,300 | $2,400 | $9,900 |
| 2016 | $570 | $12,300 | $2,400 | $9,900 |
| 2015 | $534 | $12,300 | $2,400 | $9,900 |
| 2014 | $534 | $12,300 | $2,400 | $9,900 |
Property History
We collect this data history from publicly available records. To have your information removed, we recommend requesting removal directly through your county’s website.
| Date | Event | Price | List to Sale | Price per Sq Ft | Prior Sale |
|---|---|---|---|---|---|
| 05/28/2026 05/28/26 | Price Changed | $115,000 | -4.2% | $105 / Sq Ft | |
| 05/04/2026 05/04/26 | Price Changed | $120,000 | -4.0% | $109 / Sq Ft | |
| 04/23/2026 04/23/26 | Price Changed | $125,000 | -3.8% | $114 / Sq Ft | |
| 01/08/2026 01/08/26 | Price Changed | $129,900 | -7.2% | $118 / Sq Ft | |
| 12/03/2025 12/03/25 | For Sale | $140,000 | +300.0% | $127 / Sq Ft | |
| 10/31/2019 10/31/19 | Sold | $35,000 | -16.5% | $32 / Sq Ft | View Prior Sale |
| 09/16/2019 09/16/19 | Pending | -- | -- | -- | |
| 05/01/2019 05/01/19 | Price Changed | $41,900 | -4.6% | $38 / Sq Ft | |
| 04/10/2019 04/10/19 | Price Changed | $43,900 | -2.2% | $40 / Sq Ft | |
| 04/09/2019 04/09/19 | Price Changed | $44,900 | -2.2% | $41 / Sq Ft | |
| 02/25/2019 02/25/19 | Price Changed | $45,900 | -2.1% | $42 / Sq Ft | |
| 01/02/2019 01/02/19 | Price Changed | $46,900 | -2.1% | $43 / Sq Ft | |
| 11/27/2018 11/27/18 | Price Changed | $47,900 | -2.0% | $44 / Sq Ft | |
| 11/12/2018 11/12/18 | Price Changed | $48,900 | -2.0% | $44 / Sq Ft | |
| 10/16/2018 10/16/18 | Price Changed | $49,900 | -9.1% | $45 / Sq Ft | |
| 10/10/2018 10/10/18 | Price Changed | $54,900 | +10.0% | $50 / Sq Ft | |
| 09/19/2018 09/19/18 | For Sale | $49,900 | 0.0% | $45 / Sq Ft | |
| 06/23/2016 06/23/16 | Rented | $800 | -8.6% | -- | |
| 06/22/2016 06/22/16 | Under Contract | -- | -- | -- | |
| 12/31/2015 12/31/15 | For Rent | $875 | +16.7% | -- | |
| 10/01/2015 10/01/15 | Rented | $750 | -25.0% | -- | |
| 10/01/2015 10/01/15 | Under Contract | -- | -- | -- | |
| 03/16/2015 03/16/15 | For Rent | $1,000 | 0.0% | -- | |
| 03/12/2015 03/12/15 | Sold | $13,900 | -6.7% | $139 / Sq Ft | View Prior Sale |
| 03/25/2014 03/25/14 | For Sale | $14,900 | -- | $149 / Sq Ft |
Purchase History
We collect this data history from publicly available records. To have your information removed, we recommend requesting removal directly through your county’s website.
| Date | Type | Sale Price | Title Company |
|---|---|---|---|
| Deed | -- | None Available | |
| Deed | $13,900 | -- | |
| Deed | $85,000 | None Available | |
| Deed | $64,000 | None Available |
Mortgage History
We collect this data history from publicly available records. To have your information removed, we recommend requesting removal directly through your county’s website.
| Date | Status | Loan Amount | Loan Type |
|---|---|---|---|
| Previous Owner | $76,500 | Purchase Money Mortgage |
Source: Bright MLS
MLS Number: DENC2094090
APN: 26-042.30-241
Disclaimer: Certain information contained herein is derived from information provided by parties other than Homes.com. All information provided is deemed reliable, but is not guaranteed to be accurate and should be independently verified.
![]() The data relating to real estate for sale on this website appears in part through the BRIGHT Internet Data Exchange program, a voluntary cooperative exchange of property listing data between licensed real estate brokerage firms, and is provided by BRIGHT through a licensing agreement.
The data relating to real estate for sale on this website appears in part through the BRIGHT Internet Data Exchange program, a voluntary cooperative exchange of property listing data between licensed real estate brokerage firms, and is provided by BRIGHT through a licensing agreement.
Listing information is from various brokers who participate in the Bright MLS IDX program and not all listings may be visible on the site.
The property information being provided on or through the website is for the personal, non-commercial use of consumers and such information may not be used for any purpose other than to identify prospective properties consumers may be interested in purchasing.
Some properties which appear for sale on the website may no longer be available because they are for instance, under contract, sold or are no longer being offered for sale.
Property information displayed is deemed reliable but is not guaranteed.
Copyright 2026 Bright MLS, Inc.
- 104 Lower Oak St
- 109 Stroud St
- 751 Maryland Ave
- 106 Cedar St
- 923 Wright St
- 705 S Van Buren St
- 1000 Wright St
- 515 S Jackson St
- 1025 Coleman St
- 526 S Harrison St
- 317 5th Ave
- 529 S Harrison St
- 903 Maple St
- 606 S Franklin St
- 1327 Oak St
- 1204 Brown St
- 1322 Maryland Ave
- 1327 Maryland Ave
- 1015 1/2 Linden St
- 909 S Broom St
- 4 Lower Oak St
- 1110 Maple St
- 428 S Jackson St
- 211 7th Ave
- 1401 Maryland Ave
- 304 Porter St
- 331 Justison St
- 401 S Justison St
- 1508 Maryland Ave
- 530 Harlan Blvd Unit 421
- 1110 Read St
- 1114 Lancaster Ave
- 1601 E Latimer Place
- 1029 Lancaster Ave
- 1601 Bonwood Rd
- 101 Ave of the Arts
- 1600 Bonwood Rd
- 207 S Dupont St Unit 2
- 105 Christina Landing Dr Unit 11
- 105 Christina Landing Dr Unit 1105

Ask me questions while you tour the home.