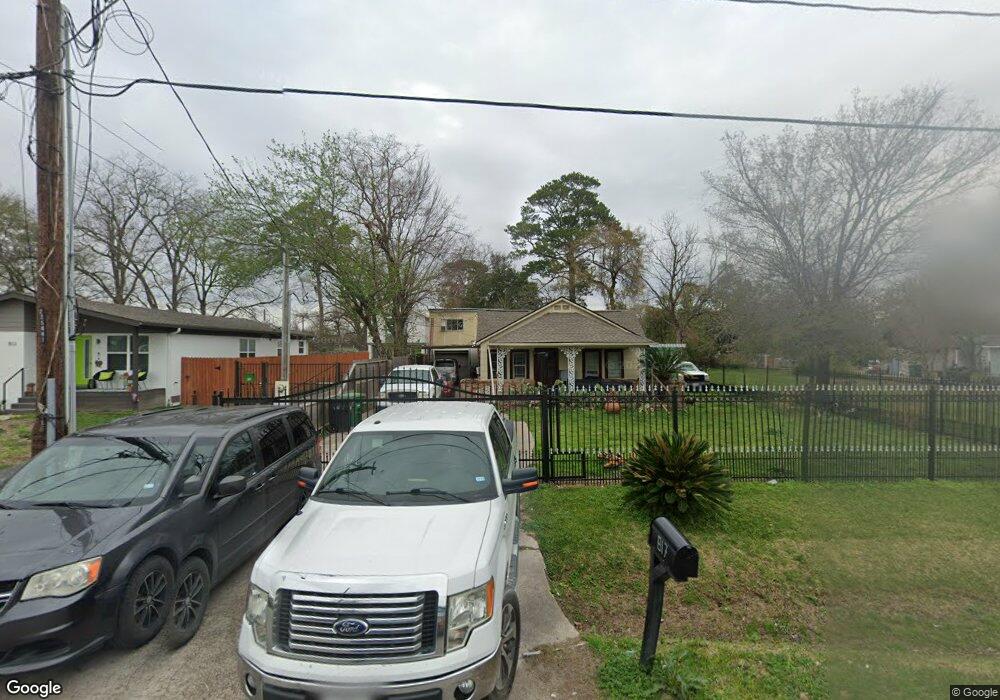
817 Mcdaniel St Houston, TX 77022
Northside-Northline NeighborhoodEstimated Value: $276,000 - $328,000
4
Beds
3
Baths
2,981
Sq Ft
$103/Sq Ft
Est. Value
About This Home
This home is located at 817 Mcdaniel St, Houston, TX 77022 and is currently estimated at $307,648, approximately $103 per square foot. 817 Mcdaniel St is a home located in Harris County with nearby schools including Janowski Elementary School, Burbank Middle School, and Sam Houston Math, Science & Technology Center.
Ownership History
Date
Name
Owned For
Owner Type
Purchase Details
Closed on
Dec 16, 2024
Sold by
Maldonado Candelaria Ignacia Zepeda and Torres Martin Espinosa
Bought by
Torres Martin Espinosa
Current Estimated Value
Purchase Details
Closed on
Apr 23, 2016
Sold by
Sanjuan Benjamin
Bought by
Torres Martin Espinoza and Ingancia Candelaria
Purchase Details
Closed on
Jun 1, 2010
Sold by
Jones E J and Harris County
Bought by
Sanjuan Benjamin
Purchase Details
Closed on
Feb 11, 2010
Sold by
Jones E J and Dayton Ernest
Bought by
County Of Harris
Purchase Details
Closed on
Aug 23, 1996
Sold by
Weeden Johnnie V
Bought by
Mcnaspy Michael P and Mcnaspy Robert Paul
Purchase Details
Closed on
Aug 22, 1996
Sold by
Mcnaspy Michael P and Mcnaspy Robert Paul
Bought by
Jones E J
Purchase Details
Closed on
Aug 26, 1993
Sold by
Law Orin
Bought by
Mcnaspy Emmet B and Mcnaspy Alma E
Create a Home Valuation Report for This Property
The Home Valuation Report is an in-depth analysis detailing your home's value as well as a comparison with similar homes in the area
Home Values in the Area
Average Home Value in this Area
Purchase History
| Date | Buyer | Sale Price | Title Company |
|---|---|---|---|
| Torres Martin Espinosa | -- | None Listed On Document | |
| Torres Martin Espinoza | -- | None Available | |
| Sanjuan Benjamin | $15,000 | None Available | |
| County Of Harris | -- | None Available | |
| Mcnaspy Michael P | -- | -- | |
| Jones E J | -- | -- | |
| Mcnaspy Emmet B | -- | -- |
Source: Public Records
Tax History
| Year | Tax Paid | Tax Assessment Tax Assessment Total Assessment is a certain percentage of the fair market value that is determined by local assessors to be the total taxable value of land and additions on the property. | Land | Improvement |
|---|---|---|---|---|
| 2025 | $4,165 | $211,040 | $126,920 | $84,120 |
| 2024 | $4,165 | $199,063 | $116,483 | $82,580 |
| 2023 | $4,044 | $200,710 | $70,975 | $129,735 |
| 2022 | $3,785 | $171,893 | $70,975 | $100,918 |
| 2021 | $3,360 | $144,148 | $70,975 | $73,173 |
| 2020 | $3,256 | $134,470 | $70,975 | $63,495 |
| 2019 | $2,910 | $128,261 | $58,450 | $69,811 |
| 2018 | $2,606 | $103,000 | $48,848 | $54,152 |
| 2017 | $2,604 | $103,000 | $48,848 | $54,152 |
| 2016 | $3,136 | $124,016 | $45,925 | $78,091 |
| 2015 | $2,606 | $101,377 | $33,400 | $67,977 |
| 2014 | $2,606 | $101,377 | $33,400 | $67,977 |
Source: Public Records
Map
Nearby Homes
- 741 Mcdaniel St
- 726 Mcdaniel St
- 743 Apache St
- 714 Apache St
- 720 Caperton St
- 909 Yorkshire St Unit 8
- 8109 W Hardy Rd
- 1104 Charnwood St
- 7714 Helmers St
- 916 Berry Rd
- 1115 Post St
- 822 Berry Sage Ln
- 802 Berry Sage Ln
- 8440 Berry Brush Ln
- 525 Eubanks St
- 1815 Eubanks St
- 1009 Wainwright St
- 604 Yorkshire St
- 0 Appleton St
- 605 Post St
- 815 Mcdaniel St
- 821 Mcdaniel St
- 825 Mcdaniel St
- 809 Mcdaniel St
- 818 Eubanks St
- 818 Eubanks St
- 901 Mcdaniel St
- 805 Mcdaniel St
- 816 Eubanks St
- 812 Mcdaniel St
- 820 Eubanks St
- 909 Mcdaniel St
- 824 Eubanks St
- 7704 Irvington Blvd
- 802 Eubanks St
- 7702 Irvington Bl
- 824 Mcdaniel St
- 902 Eubanks St
- 826 Mcdaniel St
- 913 Mcdaniel St
Your Personal Tour Guide
Ask me questions while you tour the home.