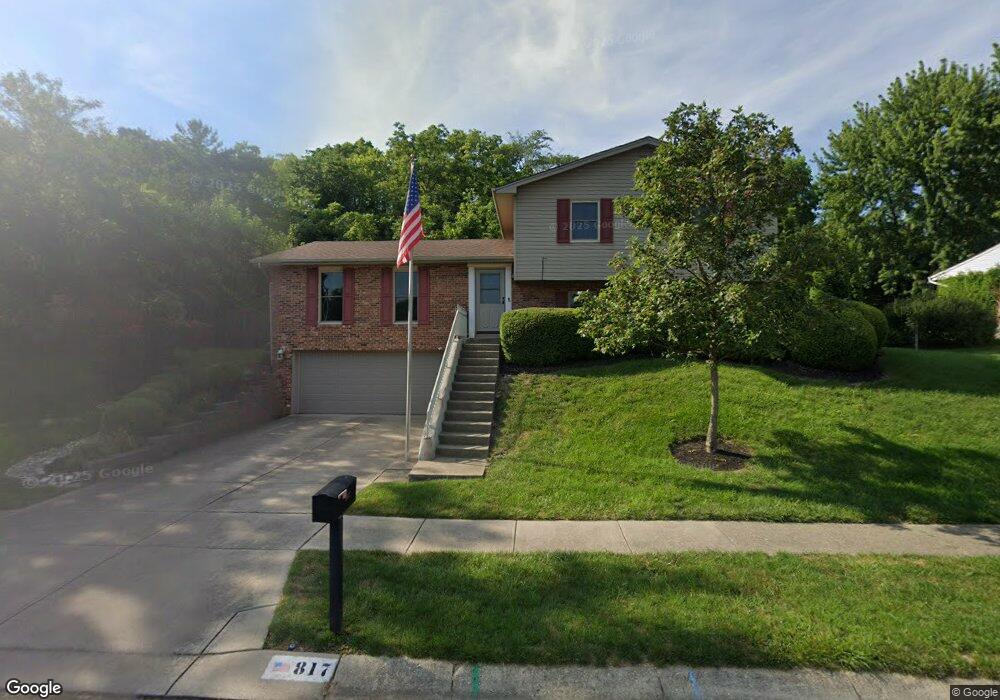
817 Merry John Dr Miamisburg, OH 45342
Estimated Value: $254,616 - $283,000
3
Beds
2
Baths
1,392
Sq Ft
$192/Sq Ft
Est. Value
About This Home
This home is located at 817 Merry John Dr, Miamisburg, OH 45342 and is currently estimated at $267,904, approximately $192 per square foot. 817 Merry John Dr is a home located in Montgomery County with nearby schools including Miamisburg High School and Bethel Baptist School.
Ownership History
Date
Name
Owned For
Owner Type
Purchase Details
Closed on
Apr 13, 2000
Sold by
Joyce Hansen and Joyce H
Bought by
Tiebout Michael H and Tiebout Joyce H
Current Estimated Value
Home Financials for this Owner
Home Financials are based on the most recent Mortgage that was taken out on this home.
Original Mortgage
$100,000
Interest Rate
8.99%
Create a Home Valuation Report for This Property
The Home Valuation Report is an in-depth analysis detailing your home's value as well as a comparison with similar homes in the area
Home Values in the Area
Average Home Value in this Area
Purchase History
| Date | Buyer | Sale Price | Title Company |
|---|---|---|---|
| Tiebout Michael H | -- | -- |
Source: Public Records
Mortgage History
| Date | Status | Borrower | Loan Amount |
|---|---|---|---|
| Previous Owner | Tiebout Michael H | $100,000 | |
| Previous Owner | Tiebout Michael H | $15,993 |
Source: Public Records
Tax History Compared to Growth
Tax History
| Year | Tax Paid | Tax Assessment Tax Assessment Total Assessment is a certain percentage of the fair market value that is determined by local assessors to be the total taxable value of land and additions on the property. | Land | Improvement |
|---|---|---|---|---|
| 2024 | $4,308 | $67,860 | $14,490 | $53,370 |
| 2023 | $4,308 | $67,860 | $14,490 | $53,370 |
| 2022 | $4,259 | $56,550 | $12,080 | $44,470 |
| 2021 | $3,767 | $56,550 | $12,080 | $44,470 |
| 2020 | $3,761 | $56,550 | $12,080 | $44,470 |
| 2019 | $3,315 | $45,740 | $10,500 | $35,240 |
| 2018 | $3,326 | $45,740 | $10,500 | $35,240 |
| 2017 | $3,304 | $45,740 | $10,500 | $35,240 |
| 2016 | $3,048 | $40,660 | $10,500 | $30,160 |
| 2015 | $2,989 | $40,660 | $10,500 | $30,160 |
| 2014 | $2,989 | $40,660 | $10,500 | $30,160 |
| 2012 | -- | $46,170 | $13,300 | $32,870 |
Source: Public Records
Map
Nearby Homes
- 2302 King Richard Pkwy
- 838 Maid Marion Ct
- 700 N Gebhart Church Rd
- 2125 Sherwood Forest Dr
- 2061 Pine Forest Dr
- 1803 Cudgell Dr
- 703 Friar Tuck Ct
- 524 N Lindsey Ave
- 857 Lea Castle Place
- 516 N Lindsey Ave
- 1100 S Elm St
- 514 N Lindsey Ave
- 609 Kings Cross Ct
- 500 Lincoln Green Dr
- 432 Crusader Dr
- 2090 E Central Ave
- 1678 Carolyn Dr
- 429 Wilson Park Dr
- 1642 Carolyn Dr
- 1000 Skyview Dr
- 815 Merry John Dr
- 819 Merry John Dr
- 814 Merry John Dr
- 813 Merry John Dr
- 816 Merry John Dr
- 812 Merry John Dr
- 821 Merry John Dr
- 818 Merry John Dr
- 810 Merry John Dr
- 811 Merry John Dr
- 2315 King Richard Pkwy
- 2313 King Richard Pkwy
- 2126 Sir Lockesley Dr
- 823 Merry John Dr
- 2317 King Richard Pkwy
- 1102 Sir Lockesley Dr
- 2319 King Richard Pkwy
- 2311 King Richard Pkwy
- 808 Merry John Dr
- 2124 Sir Lockesley Dr