Estimated Value: $310,954 - $349,000
3
Beds
2
Baths
1,340
Sq Ft
$241/Sq Ft
Est. Value
About This Home
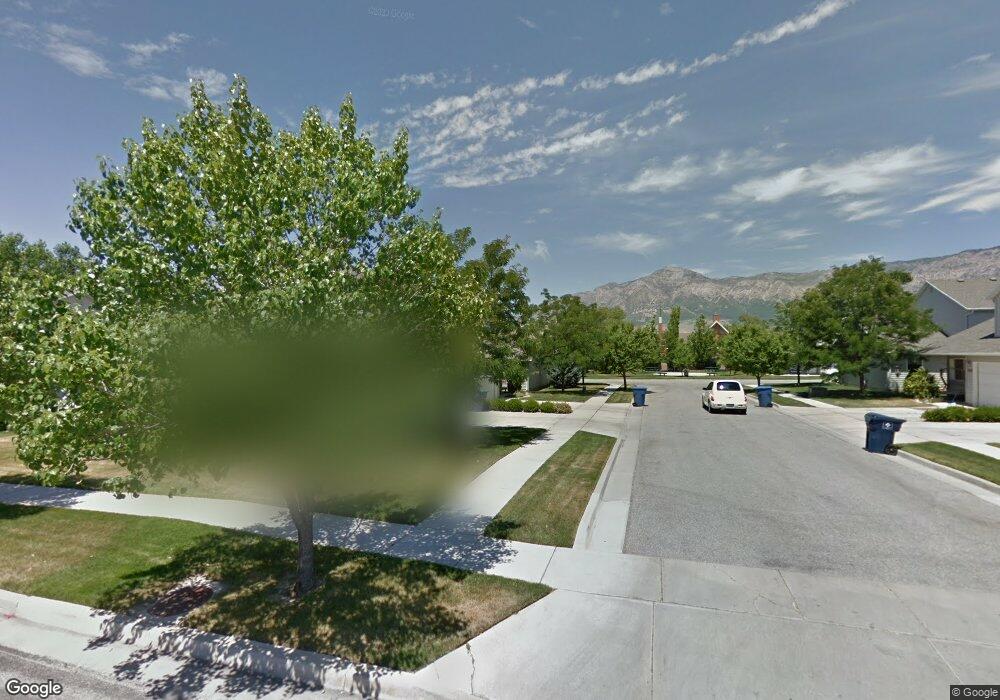
This home is located at 817 N 575 E, Ogden, UT 84404 and is currently estimated at $322,739, approximately $240 per square foot. 817 N 575 E is a home located in Weber County with nearby schools including Lincoln School, Highland Junior High School, and Ben Lomond High School.
Ownership History
Date
Name
Owned For
Owner Type
Purchase Details
Closed on
Aug 31, 2021
Sold by
Wilson Murray
Bought by
Wilson William Murray and Wilson William Murray
Current Estimated Value
Purchase Details
Closed on
Apr 9, 2018
Sold by
Stockberger Sherill
Bought by
Swisher Aaron H
Home Financials for this Owner
Home Financials are based on the most recent Mortgage that was taken out on this home.
Original Mortgage
$8,998
Outstanding Balance
$7,664
Interest Rate
4.4%
Mortgage Type
Stand Alone Second
Estimated Equity
$315,075
Purchase Details
Closed on
May 31, 2011
Sold by
Cassett Suzanne J
Bought by
Buck Rosalie
Purchase Details
Closed on
Oct 11, 2001
Sold by
Aspen Homes Development Inc
Bought by
Cassett Suzanne J
Home Financials for this Owner
Home Financials are based on the most recent Mortgage that was taken out on this home.
Original Mortgage
$98,258
Interest Rate
6.91%
Create a Home Valuation Report for This Property
The Home Valuation Report is an in-depth analysis detailing your home's value as well as a comparison with similar homes in the area
Home Values in the Area
Average Home Value in this Area
Purchase History
| Date | Buyer | Sale Price | Title Company |
|---|---|---|---|
| Wilson William Murray | -- | None Available | |
| Swisher Aaron H | -- | Us Title Insurance Agency | |
| Buck Rosalie | -- | Premier Title & Escrow | |
| Cassett Suzanne J | -- | Mountain View Title |
Source: Public Records
Mortgage History
| Date | Status | Borrower | Loan Amount |
|---|---|---|---|
| Open | Swisher Aaron H | $8,998 | |
| Previous Owner | Cassett Suzanne J | $98,258 |
Source: Public Records
Tax History
| Year | Tax Paid | Tax Assessment Tax Assessment Total Assessment is a certain percentage of the fair market value that is determined by local assessors to be the total taxable value of land and additions on the property. | Land | Improvement |
|---|---|---|---|---|
| 2025 | $2,174 | $318,760 | $65,000 | $253,760 |
| 2024 | $2,146 | $169,950 | $35,750 | $134,200 |
| 2023 | $2,091 | $166,650 | $35,750 | $130,900 |
| 2022 | $1,983 | $158,400 | $35,750 | $122,650 |
| 2021 | $1,697 | $225,000 | $50,000 | $175,000 |
| 2020 | $1,616 | $198,000 | $30,000 | $168,000 |
| 2019 | $1,539 | $177,000 | $25,000 | $152,000 |
| 2018 | $1,225 | $140,000 | $22,000 | $118,000 |
| 2017 | $1,208 | $128,900 | $22,000 | $106,900 |
| 2016 | $1,153 | $66,550 | $12,100 | $54,450 |
| 2015 | $1,006 | $56,650 | $12,100 | $44,550 |
| 2014 | $1,025 | $56,650 | $12,100 | $44,550 |
Source: Public Records
Map
Nearby Homes
- 511 E 950 N Unit 34
- 448 E 900 N Unit 6
- 461 E 960 N
- 976 N Jefferson Ave
- 526 E 980 N Unit 62
- 1001 N 550 E Unit 98
- 1010 N 525 E Unit 90
- 1020 N 525 E Unit 91
- 835 N Washington Blvd Unit 1,2
- 1031 N 525 E Unit 85
- 1013 N 450 St E Unit 60
- 965 N Liberty Ave
- 553 E 1100 N
- 826 E 760 N
- 824 E 760 N
- 827 E 760 N
- 1116 N Jefferson Ave
- 278 E Larsen Ln
- 602 Ridge Place Dr
- 264 E 700 N
Your Personal Tour Guide
Ask me questions while you tour the home.