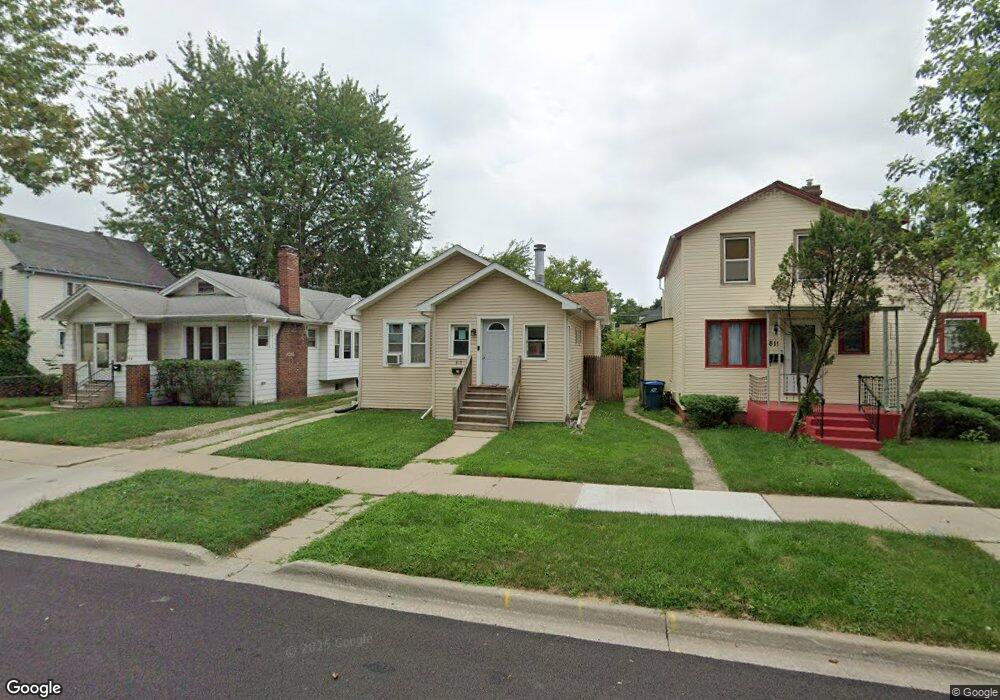
817 N Ash St Waukegan, IL 60085
Estimated Value: $167,650 - $197,000
2
Beds
1
Bath
941
Sq Ft
$193/Sq Ft
Est. Value
About This Home
This home is located at 817 N Ash St, Waukegan, IL 60085 and is currently estimated at $181,163, approximately $192 per square foot. 817 N Ash St is a home located in Lake County with nearby schools including Edith M Smith Middle School, Waukegan High School, and LEARN John & Kathy Schreiber Campus.
Ownership History
Date
Name
Owned For
Owner Type
Purchase Details
Closed on
Mar 4, 2002
Sold by
Michalski Zigmund and Russell Robert J
Bought by
Jones Lesa M
Current Estimated Value
Home Financials for this Owner
Home Financials are based on the most recent Mortgage that was taken out on this home.
Original Mortgage
$81,200
Outstanding Balance
$33,609
Interest Rate
6.93%
Mortgage Type
FHA
Estimated Equity
$147,554
Purchase Details
Closed on
Sep 14, 2001
Sold by
Arostegui Sofia and Gonzalez Ciro
Bought by
Michalski Zigmund and Russell Robert J
Purchase Details
Closed on
Aug 31, 2001
Sold by
Ladewig Larry L
Bought by
Arostegui Sofia and Gonzales Ciro
Create a Home Valuation Report for This Property
The Home Valuation Report is an in-depth analysis detailing your home's value as well as a comparison with similar homes in the area
Home Values in the Area
Average Home Value in this Area
Purchase History
| Date | Buyer | Sale Price | Title Company |
|---|---|---|---|
| Jones Lesa M | $117,000 | -- | |
| Michalski Zigmund | $83,000 | Chicago Title Insurance Comp | |
| Arostegui Sofia | -- | -- |
Source: Public Records
Mortgage History
| Date | Status | Borrower | Loan Amount |
|---|---|---|---|
| Open | Jones Lesa M | $81,200 |
Source: Public Records
Tax History Compared to Growth
Tax History
| Year | Tax Paid | Tax Assessment Tax Assessment Total Assessment is a certain percentage of the fair market value that is determined by local assessors to be the total taxable value of land and additions on the property. | Land | Improvement |
|---|---|---|---|---|
| 2024 | $2,441 | $40,083 | $6,385 | $33,698 |
| 2023 | $2,815 | $35,886 | $5,716 | $30,170 |
| 2022 | $2,815 | $36,797 | $5,436 | $31,361 |
| 2021 | $2,477 | $31,755 | $4,850 | $26,905 |
| 2020 | $2,447 | $29,583 | $4,518 | $25,065 |
| 2019 | $2,392 | $27,108 | $4,140 | $22,968 |
| 2018 | $2,376 | $26,884 | $5,274 | $21,610 |
| 2017 | $2,245 | $23,785 | $4,666 | $19,119 |
| 2016 | $1,958 | $20,669 | $4,055 | $16,614 |
| 2015 | $2,111 | $18,499 | $3,629 | $14,870 |
| 2014 | $1,531 | $14,586 | $2,683 | $11,903 |
| 2012 | $2,384 | $15,802 | $2,906 | $12,896 |
Source: Public Records
Map
Nearby Homes
- 918 N Ash St
- 620 N Poplar St
- 702 Franklin St
- 522 N Poplar St
- 415 W Ridgeland Ave
- 325 4th St
- 511 Chestnut St
- 428 N Poplar St
- 1110 N Ash St
- 452 North Ave
- 723 N County St
- 917 N Linden Ave
- 1109 Massena Ave
- 426 Julian St
- 1000 Pine St
- 1105 Woodlawn Cir
- 824 N Butrick St
- 1335 Chestnut St
- 1336 N Ash St
- 1312 N Linden Ave