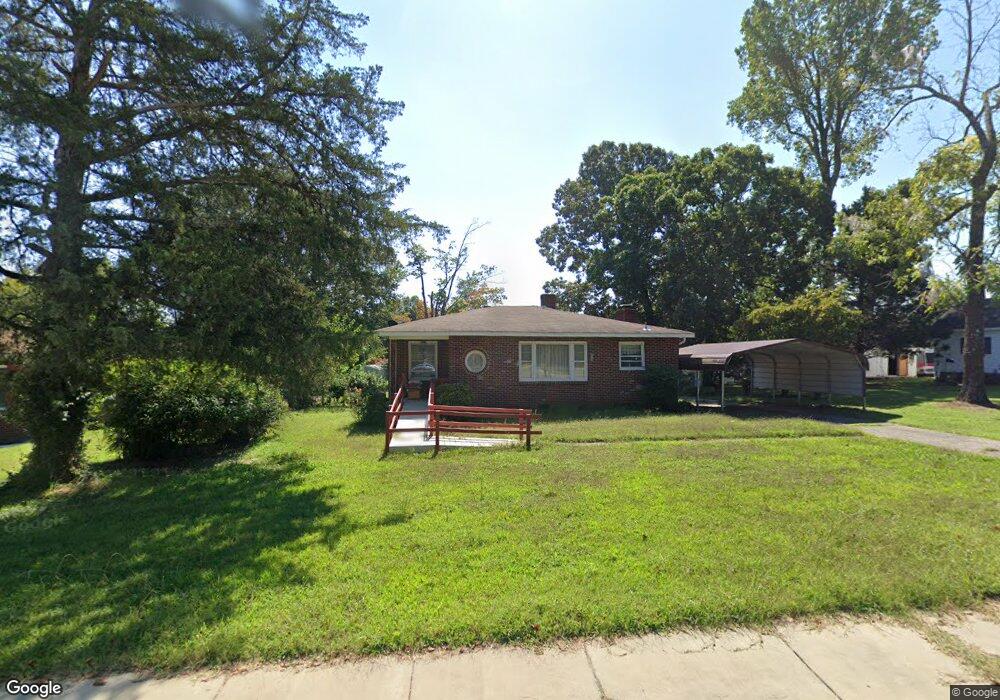
817 N Graham Hopedale Rd Burlington, NC 27217
East Burlington NeighborhoodEstimated Value: $208,000 - $270,000
2
Beds
3
Baths
1,565
Sq Ft
$149/Sq Ft
Est. Value
About This Home
This home is located at 817 N Graham Hopedale Rd, Burlington, NC 27217 and is currently estimated at $233,894, approximately $149 per square foot. 817 N Graham Hopedale Rd is a home located in Alamance County with nearby schools including Eastlawn Elementary School, Broadview Middle School, and Hugh M. Cummings High School.
Ownership History
Date
Name
Owned For
Owner Type
Purchase Details
Closed on
Oct 22, 2024
Sold by
Buckholz Arianna Mercedes and Buckholz Peter Andrew
Bought by
Buckholz Arianna Mercedes and Buckholz Peter Andrew
Current Estimated Value
Purchase Details
Closed on
Sep 2, 2022
Sold by
Russo Rosa C
Bought by
Russo Rosa C and Buchholz Arianna
Purchase Details
Closed on
Jan 4, 2017
Sold by
Russo Anthony J and Russo Rosa C
Bought by
City Of Burlington
Purchase Details
Closed on
Jun 30, 2014
Sold by
Clark Ricky L
Bought by
Russo Anthony J
Home Financials for this Owner
Home Financials are based on the most recent Mortgage that was taken out on this home.
Original Mortgage
$61,858
Interest Rate
3.75%
Mortgage Type
FHA
Purchase Details
Closed on
Apr 25, 1997
Bought by
Clark Ricky L
Create a Home Valuation Report for This Property
The Home Valuation Report is an in-depth analysis detailing your home's value as well as a comparison with similar homes in the area
Home Values in the Area
Average Home Value in this Area
Purchase History
| Date | Buyer | Sale Price | Title Company |
|---|---|---|---|
| Buckholz Arianna Mercedes | -- | None Listed On Document | |
| Russo Rosa C | -- | Palme Alexander J | |
| Russo Rosa C | -- | Palme Alexander J | |
| City Of Burlington | $1,000 | Attorney | |
| Russo Anthony J | $63,000 | -- | |
| Clark Ricky L | $50,000 | -- |
Source: Public Records
Mortgage History
| Date | Status | Borrower | Loan Amount |
|---|---|---|---|
| Previous Owner | Russo Anthony J | $61,858 |
Source: Public Records
Tax History Compared to Growth
Tax History
| Year | Tax Paid | Tax Assessment Tax Assessment Total Assessment is a certain percentage of the fair market value that is determined by local assessors to be the total taxable value of land and additions on the property. | Land | Improvement |
|---|---|---|---|---|
| 2025 | $1,051 | $212,697 | $18,500 | $194,197 |
| 2024 | $998 | $212,697 | $18,500 | $194,197 |
| 2023 | $1,636 | $179,557 | $18,500 | $161,057 |
| 2022 | $922 | $74,313 | $15,000 | $59,313 |
| 2021 | $930 | $74,313 | $15,000 | $59,313 |
| 2020 | $937 | $74,313 | $15,000 | $59,313 |
| 2019 | $940 | $74,313 | $15,000 | $59,313 |
| 2018 | $442 | $74,313 | $15,000 | $59,313 |
| 2017 | $429 | $74,313 | $15,000 | $59,313 |
| 2016 | $998 | $86,056 | $20,000 | $66,056 |
| 2015 | $500 | $86,582 | $20,000 | $66,582 |
| 2014 | -- | $86,582 | $20,000 | $66,582 |
Source: Public Records
Map
Nearby Homes
- 1907 Wilkins St
- 0 New Jersey Ave
- 2107 Wilkins St
- 1449 Knollwood Dr
- 424 Camp Rd
- 1434 Morningside Dr
- 1042 Pinnix Loop
- 2302 Mckinney St
- 1030 Pinnix Loop
- 1030 Pinnix Rd
- 1022 Pinnix Loop
- 1016 Pinnix Loop
- 1008 Pinnix Loop
- 1035 Pinnix Loop
- 1008 Pinnix Rd
- 1029 Pinnix Loop
- 1015 Pinnix Loop
- 2413 Hillford Dr
- 1007 Pinnix Loop
- 1007 Pinnix Rd
- 821 N Graham Hopedale Rd
- 801 N Graham Hopedale Rd
- 1904 S Ashland Dr
- 825 N Graham Hopedale Rd
- 1908 Wilkins St
- 822 N Graham Hopedale Rd
- 1906 S Ashland Dr
- 903 N Graham Hopedale Rd
- 814 N Graham Hopedale Rd
- 826 N Graham Hopedale Rd
- 1910 Wilkins St
- 1905 S Ashland Dr
- 830 N Graham Hopedale Rd
- 804 N Graham Hopedale Rd
- 1914 Wilkins St
- 907 N Graham Hopedale Rd
- 1910 S Ashland Dr
- 717 N Graham Hopedale Rd
- 904 N Graham Hopedale Rd
- 1911 S Ashland Dr