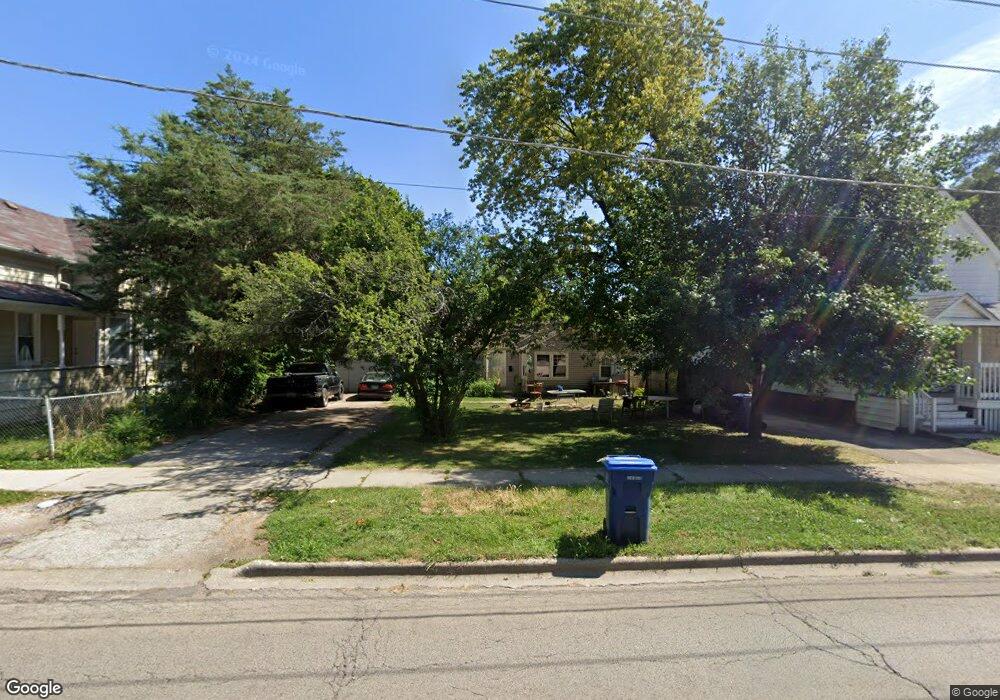
817 N Jackson St Waukegan, IL 60085
Estimated Value: $144,489 - $174,000
2
Beds
1
Bath
888
Sq Ft
$180/Sq Ft
Est. Value
About This Home
This home is located at 817 N Jackson St, Waukegan, IL 60085 and is currently estimated at $159,622, approximately $179 per square foot. 817 N Jackson St is a home located in Lake County with nearby schools including Glen Flora Elementary School, Edith M Smith Middle School, and Waukegan High School.
Ownership History
Date
Name
Owned For
Owner Type
Purchase Details
Closed on
Jun 24, 2025
Sold by
Tadayoni Abdollah
Bought by
Abdollah Tadayoni Revocable Living Trust and Tadayoni
Current Estimated Value
Purchase Details
Closed on
Jan 12, 2011
Sold by
Zhaleh Jafar
Bought by
Tadayoni Abdollah
Purchase Details
Closed on
Sep 25, 2008
Sold by
Wells Fargo Bank Na
Bought by
Tadayoni Abdollah
Purchase Details
Closed on
May 12, 2008
Sold by
Barragan Jesus and Chase Home Finance Llc
Bought by
Wells Fargo Bank Na
Purchase Details
Closed on
Oct 16, 2002
Sold by
Alvares Jose L and Cervantes Teresa
Bought by
Barragan Jesus and Perez Maribel
Home Financials for this Owner
Home Financials are based on the most recent Mortgage that was taken out on this home.
Original Mortgage
$87,220
Interest Rate
6.13%
Mortgage Type
FHA
Purchase Details
Closed on
Nov 5, 1996
Sold by
Medina Jose and Medina Rosario
Bought by
Alvarez Jose L and Cervantes Teresa
Home Financials for this Owner
Home Financials are based on the most recent Mortgage that was taken out on this home.
Original Mortgage
$64,928
Interest Rate
8.26%
Mortgage Type
FHA
Create a Home Valuation Report for This Property
The Home Valuation Report is an in-depth analysis detailing your home's value as well as a comparison with similar homes in the area
Home Values in the Area
Average Home Value in this Area
Purchase History
| Date | Buyer | Sale Price | Title Company |
|---|---|---|---|
| Abdollah Tadayoni Revocable Living Trust | -- | None Listed On Document | |
| Tadayoni Abdollah | -- | None Available | |
| Zhaleh Jafar | -- | None Available | |
| Tadayoni Abdollah | $26,500 | Fatic | |
| Wells Fargo Bank Na | -- | None Available | |
| Barragan Jesus | $88,000 | -- | |
| Alvarez Jose L | $65,000 | Chicago Title Insurance Co |
Source: Public Records
Mortgage History
| Date | Status | Borrower | Loan Amount |
|---|---|---|---|
| Previous Owner | Barragan Jesus | $87,220 | |
| Previous Owner | Alvarez Jose L | $64,928 | |
| Closed | Alvarez Jose L | $2,400 |
Source: Public Records
Tax History Compared to Growth
Tax History
| Year | Tax Paid | Tax Assessment Tax Assessment Total Assessment is a certain percentage of the fair market value that is determined by local assessors to be the total taxable value of land and additions on the property. | Land | Improvement |
|---|---|---|---|---|
| 2024 | $2,801 | $33,175 | $5,846 | $27,329 |
| 2023 | $2,700 | $29,702 | $5,234 | $24,468 |
| 2022 | $2,700 | $27,614 | $4,730 | $22,884 |
| 2021 | $2,487 | $23,851 | $4,220 | $19,631 |
| 2020 | $2,519 | $22,220 | $3,931 | $18,289 |
| 2019 | $2,535 | $20,361 | $3,602 | $16,759 |
| 2018 | $2,480 | $19,181 | $4,588 | $14,593 |
| 2017 | $2,432 | $16,970 | $4,059 | $12,911 |
| 2016 | $2,279 | $14,746 | $3,527 | $11,219 |
| 2015 | $2,229 | $13,198 | $3,157 | $10,041 |
| 2014 | $2,716 | $16,050 | $3,936 | $12,114 |
| 2012 | $3,366 | $17,390 | $4,265 | $13,125 |
Source: Public Records
Map
Nearby Homes
- 918 N Ash St
- 620 N Poplar St
- 917 N Linden Ave
- 702 Franklin St
- 1109 Massena Ave
- 522 N Poplar St
- 511 Chestnut St
- 1110 N Ash St
- 428 N Poplar St
- 1000 Pine St
- 1122 N Ash St
- 824 N Butrick St
- 1105 Woodlawn Cir
- 415 W Ridgeland Ave
- 452 North Ave
- 325 4th St
- 509 N Butrick St
- 723 N County St
- 1335 Chestnut St
- 1336 N Ash St
- 821 N Jackson St
- 811 N Jackson St
- 803 N Jackson St
- 832 Chestnut St
- 834 Chestnut St
- 828 Chestnut St
- 838 Chestnut St
- 821 Massena Ave
- 817 Massena Ave
- 826 Chestnut St
- 801 N Jackson St
- 814 N Jackson St
- 816 N Jackson St
- 812 N Jackson St
- 809 Massena Ave
- 810 N Jackson St
- 822 Chestnut St
- 850 N Jackson St
- 805 Massena Ave
- 806 N Jackson St