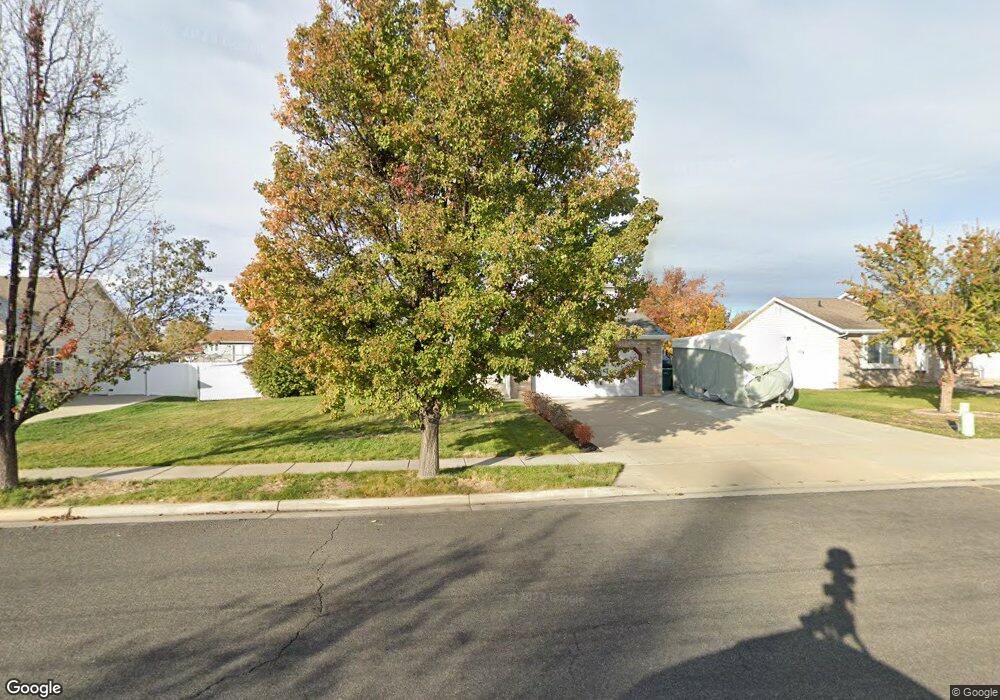
817 S 1150 W Clearfield, UT 84015
Estimated Value: $432,000 - $498,000
3
Beds
2
Baths
2,217
Sq Ft
$210/Sq Ft
Est. Value
About This Home
This home is located at 817 S 1150 W, Clearfield, UT 84015 and is currently estimated at $464,484, approximately $209 per square foot. 817 S 1150 W is a home located in Davis County with nearby schools including Cook School, Syracuse Junior High School, and Syracuse High School.
Ownership History
Date
Name
Owned For
Owner Type
Purchase Details
Closed on
Mar 27, 2003
Sold by
Hampton Glenn A and Hampton Shelly
Bought by
Smerkol Bruce F and Smerkol Tilcia E
Current Estimated Value
Purchase Details
Closed on
Sep 24, 1999
Sold by
Hampton Glenn A
Bought by
Hampton Glenn A and Hampton Shelly
Home Financials for this Owner
Home Financials are based on the most recent Mortgage that was taken out on this home.
Original Mortgage
$127,500
Interest Rate
9.99%
Purchase Details
Closed on
Aug 3, 1998
Sold by
Shepherd Scott R
Bought by
Hampton Glenn A and Hampton Shelly
Home Financials for this Owner
Home Financials are based on the most recent Mortgage that was taken out on this home.
Original Mortgage
$115,650
Interest Rate
6.95%
Create a Home Valuation Report for This Property
The Home Valuation Report is an in-depth analysis detailing your home's value as well as a comparison with similar homes in the area
Home Values in the Area
Average Home Value in this Area
Purchase History
| Date | Buyer | Sale Price | Title Company |
|---|---|---|---|
| Smerkol Bruce F | -- | Bonneville Title Company Inc | |
| Hampton Glenn A | -- | America West Title Agency In | |
| Hampton Glenn A | -- | America West Title Agency In | |
| Hampton Glenn A | -- | Bonneville Title Company Inc | |
| Shepherd Scott R | -- | Bonneville Title Company Inc |
Source: Public Records
Mortgage History
| Date | Status | Borrower | Loan Amount |
|---|---|---|---|
| Previous Owner | Hampton Glenn A | $127,500 | |
| Previous Owner | Hampton Glenn A | $115,650 | |
| Closed | Hampton Glenn A | $6,425 |
Source: Public Records
Tax History Compared to Growth
Tax History
| Year | Tax Paid | Tax Assessment Tax Assessment Total Assessment is a certain percentage of the fair market value that is determined by local assessors to be the total taxable value of land and additions on the property. | Land | Improvement |
|---|---|---|---|---|
| 2025 | $2,541 | $227,700 | $72,093 | $155,607 |
| 2024 | $2,455 | $221,650 | $68,925 | $152,725 |
| 2023 | $2,275 | $377,000 | $110,323 | $266,677 |
| 2022 | $2,467 | $221,100 | $63,209 | $157,891 |
| 2021 | $2,186 | $296,000 | $67,057 | $228,943 |
| 2020 | $1,896 | $255,000 | $56,367 | $198,633 |
| 2019 | $1,823 | $242,000 | $59,172 | $182,828 |
| 2018 | $1,647 | $213,000 | $52,521 | $160,479 |
| 2016 | $1,450 | $98,010 | $20,970 | $77,040 |
| 2015 | $1,381 | $89,045 | $20,970 | $68,075 |
| 2014 | $1,348 | $88,074 | $20,970 | $67,104 |
| 2013 | -- | $85,735 | $31,185 | $54,550 |
Source: Public Records
Map
Nearby Homes