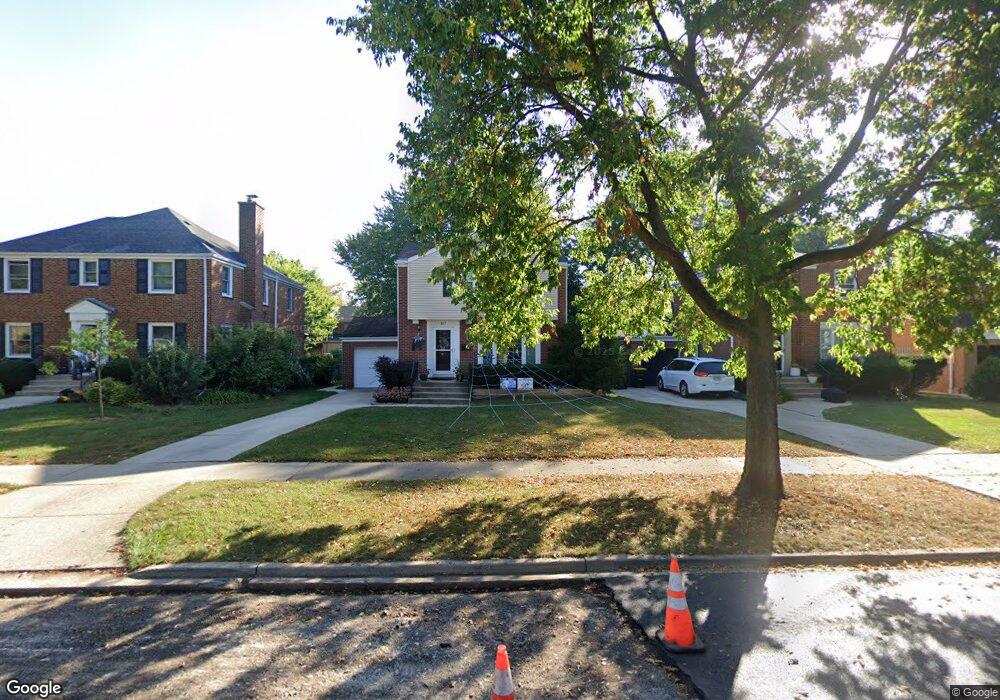
817 S Ashland Ave La Grange, IL 60525
Estimated Value: $501,021 - $682,000
3
Beds
2
Baths
1,152
Sq Ft
$492/Sq Ft
Est. Value
About This Home
This home is located at 817 S Ashland Ave, La Grange, IL 60525 and is currently estimated at $566,755, approximately $491 per square foot. 817 S Ashland Ave is a home located in Cook County with nearby schools including Spring Avenue Elementary School, William F. Gurrie Middle School, and Lyons Township High School.
Ownership History
Date
Name
Owned For
Owner Type
Purchase Details
Closed on
Jul 10, 2007
Sold by
Murray Matthew and Murray Kristin
Bought by
Flood Brian and Flood Molly
Current Estimated Value
Home Financials for this Owner
Home Financials are based on the most recent Mortgage that was taken out on this home.
Original Mortgage
$336,000
Outstanding Balance
$212,846
Interest Rate
6.76%
Mortgage Type
Unknown
Estimated Equity
$353,909
Purchase Details
Closed on
Jan 14, 2002
Sold by
Shapiro Peter H and Shapiro Angeline K
Bought by
Murray Matthew and Murray Kristin
Purchase Details
Closed on
Mar 22, 1996
Sold by
First National Bank Of La Grange
Bought by
Shapiro Peter H and Shapiro Angeline K
Home Financials for this Owner
Home Financials are based on the most recent Mortgage that was taken out on this home.
Original Mortgage
$169,200
Interest Rate
7.25%
Create a Home Valuation Report for This Property
The Home Valuation Report is an in-depth analysis detailing your home's value as well as a comparison with similar homes in the area
Home Values in the Area
Average Home Value in this Area
Purchase History
| Date | Buyer | Sale Price | Title Company |
|---|---|---|---|
| Flood Brian | $420,000 | First American Title | |
| Murray Matthew | $287,500 | Premier Title | |
| Shapiro Peter H | $188,000 | Attorneys Natl Title Network |
Source: Public Records
Mortgage History
| Date | Status | Borrower | Loan Amount |
|---|---|---|---|
| Open | Flood Brian | $336,000 | |
| Previous Owner | Shapiro Peter H | $169,200 |
Source: Public Records
Tax History Compared to Growth
Tax History
| Year | Tax Paid | Tax Assessment Tax Assessment Total Assessment is a certain percentage of the fair market value that is determined by local assessors to be the total taxable value of land and additions on the property. | Land | Improvement |
|---|---|---|---|---|
| 2024 | $8,673 | $32,896 | $5,996 | $26,900 |
| 2023 | $7,224 | $39,980 | $5,996 | $33,984 |
| 2022 | $7,224 | $29,146 | $5,228 | $23,918 |
| 2021 | $7,391 | $30,751 | $5,227 | $25,524 |
| 2020 | $7,221 | $30,751 | $5,227 | $25,524 |
| 2019 | $7,007 | $30,006 | $4,766 | $25,240 |
| 2018 | $6,918 | $30,006 | $4,766 | $25,240 |
| 2017 | $6,736 | $30,006 | $4,766 | $25,240 |
| 2016 | $6,760 | $27,225 | $4,151 | $23,074 |
| 2015 | $6,629 | $27,225 | $4,151 | $23,074 |
| 2014 | $6,982 | $29,011 | $4,151 | $24,860 |
| 2013 | $8,159 | $34,464 | $4,151 | $30,313 |
Source: Public Records
Map
Nearby Homes
- 736 S Ashland Ave
- 715 S Catherine Ave
- 617 S Madison Ave
- 301 E Plainfield Rd Unit 6
- 524 S Ashland Ave
- 600 8th Ave
- 510 S 6th Ave
- 1001 S Brainard Ave
- 5348 6th Ave
- 430 S La Grange Rd
- 413 S Kensington Ave
- 509 S Brainard Ave
- 334 S Ashland Ave
- 347 S 8th Ave
- 418 Bluff Ave
- 500 S Edgewood Ave
- 424 E Maple Ave
- 4601 Eberly Ave
- 5441 S Edgewood Ave
- 1392 W 52nd Place
- 821 S Ashland Ave
- 813 S Ashland Ave
- 827 S Ashland Ave
- 809 S Ashland Ave
- 820 S Madison Ave
- 812 S Madison Ave
- 822 S Madison Ave
- 805 S Ashland Ave
- 831 S Ashland Ave
- 810 S Madison Ave
- 824 S Madison Ave
- 818 S Ashland Ave
- 804 S Madison Ave
- 828 S Madison Ave
- 822 S Ashland Ave
- 814 S Ashland Ave
- 801 S Ashland Ave
- 824 S Ashland Ave
- 808 S Ashland Ave
- 800 S Madison Ave