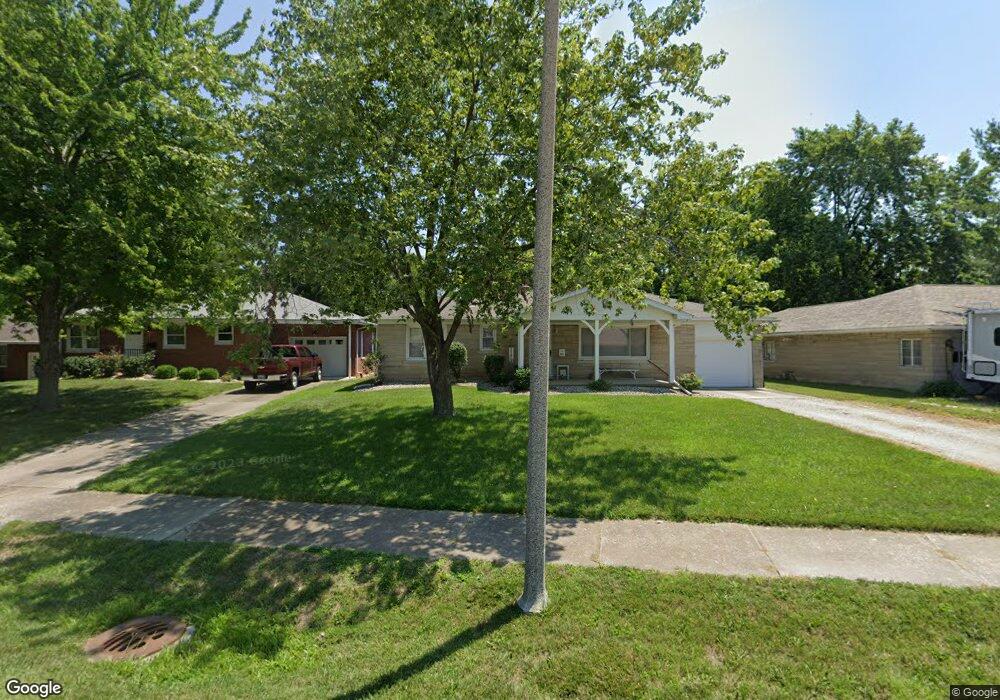
817 Sycamore St Highland, IL 62249
Estimated Value: $187,096 - $222,000
4
Beds
1
Bath
1,155
Sq Ft
$176/Sq Ft
Est. Value
About This Home
This home is located at 817 Sycamore St, Highland, IL 62249 and is currently estimated at $203,774, approximately $176 per square foot. 817 Sycamore St is a home located in Madison County with nearby schools including Highland High School and St Paul Catholic School.
Ownership History
Date
Name
Owned For
Owner Type
Purchase Details
Closed on
Jun 13, 2008
Sold by
Kustermann Austin R
Bought by
Hummel Charles F and Hummel Ashley S
Current Estimated Value
Home Financials for this Owner
Home Financials are based on the most recent Mortgage that was taken out on this home.
Original Mortgage
$139,707
Outstanding Balance
$89,604
Interest Rate
6.04%
Mortgage Type
FHA
Estimated Equity
$114,170
Purchase Details
Closed on
Feb 22, 2008
Sold by
Frey Larry J
Bought by
Kusterman Austin R
Home Financials for this Owner
Home Financials are based on the most recent Mortgage that was taken out on this home.
Original Mortgage
$100,000
Interest Rate
7.2%
Mortgage Type
Purchase Money Mortgage
Purchase Details
Closed on
Nov 12, 2003
Sold by
Maroon Jeanne and Maroon Michael
Bought by
Frey Larry J
Home Financials for this Owner
Home Financials are based on the most recent Mortgage that was taken out on this home.
Original Mortgage
$75,000
Interest Rate
5.11%
Mortgage Type
Purchase Money Mortgage
Create a Home Valuation Report for This Property
The Home Valuation Report is an in-depth analysis detailing your home's value as well as a comparison with similar homes in the area
Home Values in the Area
Average Home Value in this Area
Purchase History
| Date | Buyer | Sale Price | Title Company |
|---|---|---|---|
| Hummel Charles F | $142,000 | Title & Escrow Plus Inc | |
| Kusterman Austin R | $90,000 | Title & Escrow Plus Inc | |
| Frey Larry J | $94,000 | Community Title & Escrow |
Source: Public Records
Mortgage History
| Date | Status | Borrower | Loan Amount |
|---|---|---|---|
| Open | Hummel Charles F | $139,707 | |
| Previous Owner | Kusterman Austin R | $100,000 | |
| Previous Owner | Frey Larry J | $75,000 |
Source: Public Records
Tax History Compared to Growth
Tax History
| Year | Tax Paid | Tax Assessment Tax Assessment Total Assessment is a certain percentage of the fair market value that is determined by local assessors to be the total taxable value of land and additions on the property. | Land | Improvement |
|---|---|---|---|---|
| 2024 | $4,241 | $63,010 | $10,080 | $52,930 |
| 2023 | $4,241 | $57,060 | $9,130 | $47,930 |
| 2022 | $3,895 | $52,680 | $8,430 | $44,250 |
| 2021 | $3,545 | $49,700 | $7,950 | $41,750 |
| 2020 | $3,485 | $48,160 | $7,700 | $40,460 |
| 2019 | $3,433 | $47,480 | $7,590 | $39,890 |
| 2018 | $3,400 | $44,790 | $7,160 | $37,630 |
| 2017 | $3,350 | $43,660 | $6,980 | $36,680 |
| 2016 | $3,268 | $43,660 | $6,980 | $36,680 |
| 2015 | $3,188 | $43,810 | $7,010 | $36,800 |
| 2014 | $3,188 | $43,810 | $7,010 | $36,800 |
| 2013 | $3,188 | $43,810 | $7,010 | $36,800 |
Source: Public Records
Map
Nearby Homes
- 1520 7th St
- 804 Dolphin Dr W
- 1505 6th St
- 1500 Poplar St
- 1501 Poplar St Unit 2
- 613 Washington St
- 1601 Poplar St
- 1615 Maple St
- 1700 Cypress St
- 2130 Saint Raphael Ct
- 1222 Laurel St
- 1809 Olive St
- 180 Keeven Dr
- 520 13th St
- 120 Suppiger Ln Unit 202
- 2115 Hill Crest Dr
- 1632 24th St
- XXX Faith Dr
- 2131 Hill Crest Dr
- 213 Broadway