Estimated payment $1,730/month
Highlights
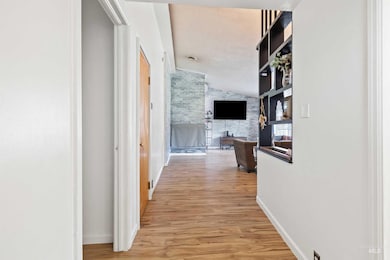
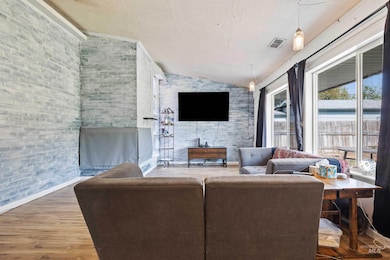
- 1 Fireplace
- Tile Countertops
- Outdoor Storage
- Filer Intermediate School Rated 9+
- 1-Story Property
- Forced Air Heating and Cooling System
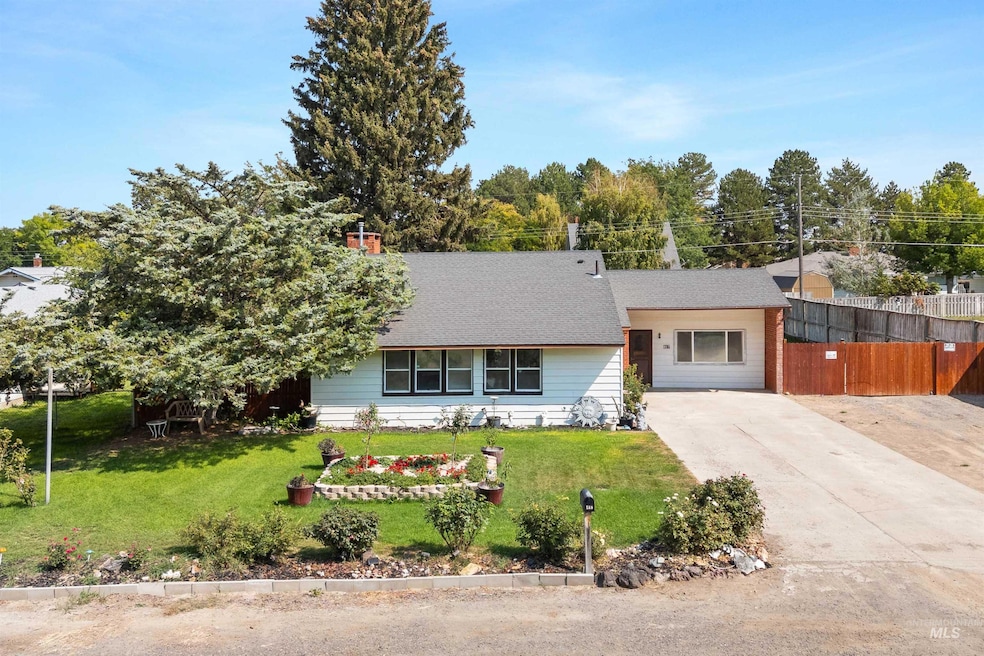
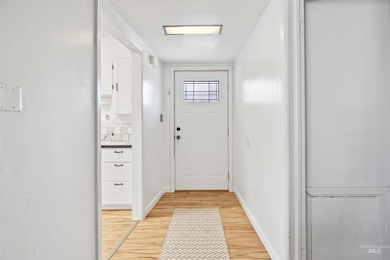
About This Home
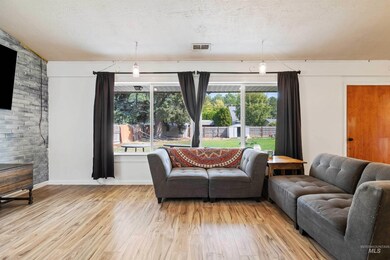
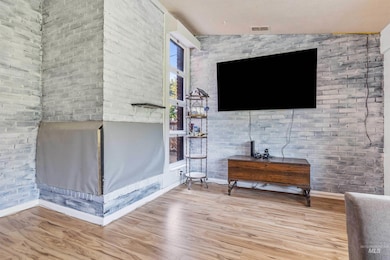
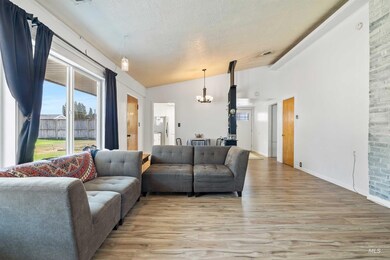
This charming single-level home offers 2 bedrooms, 1 bathroom layout with office space or potential for 3rd bedroom option, all situated on an oversized city lot of 0.32-acres with room for RV parking or shop space. Step inside to discover updated LVP flooring, a bright white kitchen with stainless steel appliances, and updated bathroom. Built-in closets provide ample storage throughout. Smart lights in Bathroom, Kitchen, and master bedroom. Unique additional front door access with a "Butler entrance" for those Costco run straight into the pantry. Potential for 2nd bathroom in utility room. Outside, the large lot offers extra off-street parking, RV or extra vehicle parking, shop, 220 volt hookup for hot tub, and a spacious backyard, garden area with irrigation water and electrical, and 2 tool garden storage sheds—perfect for outdoor enthusiasts or hobbyists. Conveniently located just minutes from Twin Falls, this home is ideal for first-time buyers looking to escape renting. Don’t miss your chance to make this property yours—schedule your private showing today!
Listing Agent
208 Real Estate, LLC - Twin Falls Brokerage Phone: 208-732-0208 Listed on: 09/12/2025
Home Details
Home Type
- Single Family
Est. Annual Taxes
- $1,659
Year Built
- Built in 1949
Lot Details
- 13,939 Sq Ft Lot
- Lot Dimensions are 150x93
Home Design
- Brick Exterior Construction
- Composition Roof
- Metal Siding
- Vinyl Siding
Interior Spaces
- 1,524 Sq Ft Home
- 1-Story Property
- 1 Fireplace
Kitchen
- Oven or Range
- Gas Range
- Dishwasher
- Tile Countertops
Bedrooms and Bathrooms
- 2 Main Level Bedrooms
- 1 Bathroom
Outdoor Features
- Outdoor Storage
Schools
- Filer Elementary And Middle School
- Filer High School
Utilities
- Forced Air Heating and Cooling System
- Heating System Uses Natural Gas
- Gas Water Heater
Listing and Financial Details
- Assessor Parcel Number RPF8481000010B
Map
Home Values in the Area
Average Home Value in this Area
Tax History
We collect this data history from publicly available records. To have your information removed, we recommend requesting removal directly through your county’s website.
| Year | Tax Paid | Tax Assessment Tax Assessment Total Assessment is a certain percentage of the fair market value that is determined by local assessors to be the total taxable value of land and additions on the property. | Land | Improvement |
|---|---|---|---|---|
| 2025 | $1,460 | $261,633 | $79,035 | $182,598 |
| 2024 | $1,436 | $261,633 | $79,035 | $182,598 |
| 2023 | $1,431 | $272,706 | $79,035 | $193,671 |
| 2022 | $1,786 | $256,951 | $53,879 | $203,072 |
| 2021 | $1,640 | $190,472 | $34,542 | $155,930 |
| 2020 | $1,557 | $161,334 | $34,542 | $126,792 |
| 2019 | $1,659 | $155,988 | $31,518 | $124,470 |
| 2018 | $1,460 | $132,886 | $19,378 | $113,508 |
| 2017 | $2,640 | $116,524 | $19,378 | $97,146 |
| 2016 | $2,264 | $93,174 | $0 | $0 |
| 2015 | $2,108 | $87,342 | $0 | $0 |
| 2012 | -- | $83,730 | $0 | $0 |
Property History
We collect this data history from publicly available records. To have your information removed, we recommend requesting removal directly through your county’s website.
| Date | Event | Price | List to Sale | Price per Sq Ft |
|---|---|---|---|---|
| 05/20/2026 05/20/26 | Pending | -- | -- | -- |
| 05/14/2026 05/14/26 | Price Changed | $299,900 | -1.7% | $197 / Sq Ft |
| 04/12/2026 04/12/26 | Price Changed | $305,000 | -1.6% | $200 / Sq Ft |
| 02/03/2026 02/03/26 | For Sale | $310,000 | 0.0% | $203 / Sq Ft |
| 01/12/2026 01/12/26 | Pending | -- | -- | -- |
| 12/02/2025 12/02/25 | Price Changed | $310,000 | -1.6% | $203 / Sq Ft |
| 09/12/2025 09/12/25 | For Sale | $315,000 | -- | $207 / Sq Ft |
Purchase History
We collect this data history from publicly available records. To have your information removed, we recommend requesting removal directly through your county’s website.
| Date | Type | Sale Price | Title Company |
|---|---|---|---|
| Warranty Deed | -- | Alliance Title | |
| Quit Claim Deed | -- | -- | |
| Special Warranty Deed | -- | -- |
Mortgage History
We collect this data history from publicly available records. To have your information removed, we recommend requesting removal directly through your county’s website.
| Date | Status | Loan Amount | Loan Type |
|---|---|---|---|
| Open | $72,800 | New Conventional | |
| Previous Owner | $71,000 | New Conventional |
Source: Intermountain MLS
MLS Number: 98961391
APN: RPF8481000010BA
Disclaimer: Certain information contained herein is derived from information provided by parties other than Homes.com. All information provided is deemed reliable, but is not guaranteed to be accurate and should be independently verified.
![]() IDX information is provided exclusively for consumers’ personal, non-commercial use, that it may not be used for any purpose other than to identify prospective properties consumers may be interested in purchasing. IMLS does not assume any liability for missing or inaccurate data.
IDX information is provided exclusively for consumers’ personal, non-commercial use, that it may not be used for any purpose other than to identify prospective properties consumers may be interested in purchasing. IMLS does not assume any liability for missing or inaccurate data.
Information provided by IMLS is deemed reliable but not guaranteed.

Ask me questions while you tour the home.