Estimated Value: $153,000 - $173,665
1
Bed
1
Bath
816
Sq Ft
$204/Sq Ft
Est. Value
About This Home
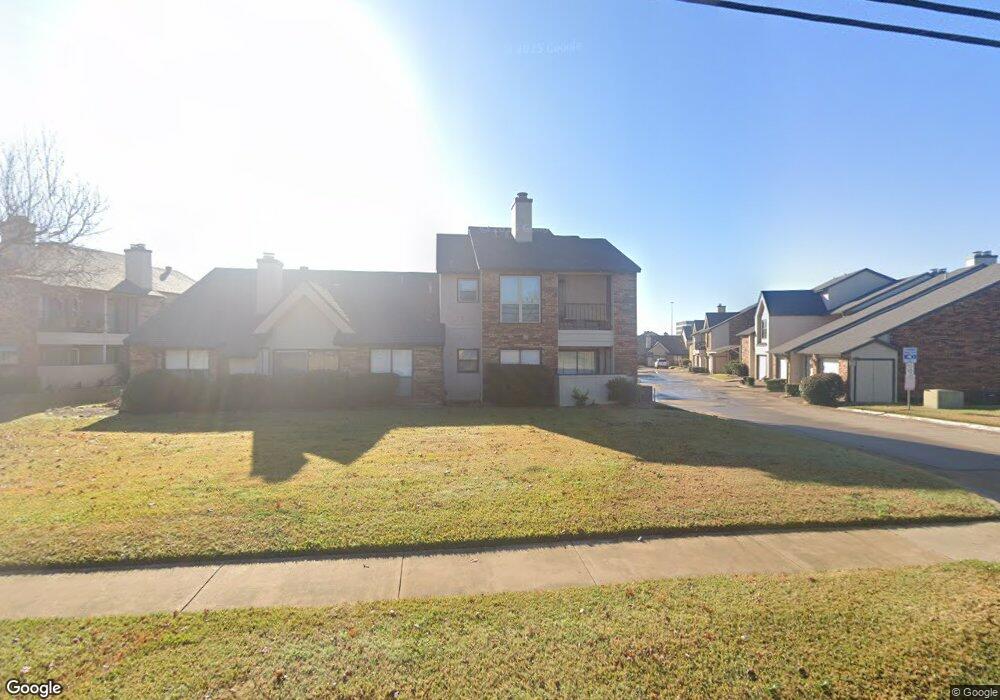
This home is located at 817 W Harwood Rd Unit C, Hurst, TX 76054 and is currently estimated at $166,416, approximately $203 per square foot. 817 W Harwood Rd Unit C is a home located in Tarrant County with nearby schools including Academy at C.F. Thomas Elementary, Richland Middle School, and Birdville High School.
Ownership History
Date
Name
Owned For
Owner Type
Purchase Details
Closed on
Sep 15, 2015
Sold by
Whiteman David
Bought by
Galarza Jose and Galarza Aixa
Current Estimated Value
Purchase Details
Closed on
Aug 3, 2010
Sold by
Babcock Tiffany Dawn
Bought by
Federal National Mortgage Association
Purchase Details
Closed on
Oct 1, 2004
Sold by
Hill Carole A
Bought by
Babcock Tiffany A
Home Financials for this Owner
Home Financials are based on the most recent Mortgage that was taken out on this home.
Original Mortgage
$57,600
Interest Rate
5.8%
Mortgage Type
Purchase Money Mortgage
Purchase Details
Closed on
Dec 31, 2001
Sold by
Carriage Property Llc
Bought by
Hill Carole A
Home Financials for this Owner
Home Financials are based on the most recent Mortgage that was taken out on this home.
Original Mortgage
$65,865
Interest Rate
7.03%
Mortgage Type
Construction
Create a Home Valuation Report for This Property
The Home Valuation Report is an in-depth analysis detailing your home's value as well as a comparison with similar homes in the area
Home Values in the Area
Average Home Value in this Area
Purchase History
| Date | Buyer | Sale Price | Title Company |
|---|---|---|---|
| Galarza Jose | -- | Capital Title | |
| Federal National Mortgage Association | $61,384 | None Available | |
| Babcock Tiffany A | -- | First Land Title | |
| Hill Carole A | -- | Safeco Land Title |
Source: Public Records
Mortgage History
| Date | Status | Borrower | Loan Amount |
|---|---|---|---|
| Previous Owner | Babcock Tiffany A | $57,600 | |
| Previous Owner | Hill Carole A | $65,865 | |
| Closed | Babcock Tiffany A | $14,400 |
Source: Public Records
Tax History Compared to Growth
Tax History
| Year | Tax Paid | Tax Assessment Tax Assessment Total Assessment is a certain percentage of the fair market value that is determined by local assessors to be the total taxable value of land and additions on the property. | Land | Improvement |
|---|---|---|---|---|
| 2025 | $3,866 | $170,145 | $30,000 | $140,145 |
| 2024 | $3,866 | $170,145 | $30,000 | $140,145 |
| 2023 | $3,901 | $170,697 | $10,000 | $160,697 |
| 2022 | $3,555 | $143,772 | $10,000 | $133,772 |
| 2021 | $2,906 | $112,007 | $10,000 | $102,007 |
| 2020 | $2,071 | $80,594 | $10,000 | $70,594 |
| 2019 | $2,133 | $81,159 | $10,000 | $71,159 |
| 2018 | $2,064 | $78,528 | $3,439 | $75,089 |
| 2017 | $2,111 | $79,119 | $3,439 | $75,680 |
| 2016 | $1,626 | $67,667 | $3,439 | $64,228 |
| 2015 | $1,204 | $55,400 | $3,453 | $51,947 |
| 2014 | $1,204 | $55,400 | $3,453 | $51,947 |
Source: Public Records
Map
Nearby Homes
- 823 W Harwood Rd
- 1625 Oak Creek Dr
- 813 Overhill Ct
- 608 W Pleasantview Dr
- 521 Brookview Dr
- 520 Baker Dr
- 1204 Princess Ln
- 1230 Woodland Park Dr
- 1230 Wooded Trail
- 853 Royal Terrace
- 1220 Woodland Park Dr
- 6008 Kessler Dr
- 6001 Kessler Dr
- 425 W Pleasantview Dr
- 1218 Wooded Trail
- 6025 Kessler Dr
- 6124 Mayfair Mews
- 6105 Parker Blvd
- 8908 Redding St
- 820 Bedford Ct W
- 817 W Harwood Rd Unit D
- 817 W Harwood Rd Unit A
- 819 W Harwood Rd Unit 835-E
- 815 W Harwood Rd Unit D
- 815 W Harwood Rd Unit C
- 815 W Harwood Rd Unit B
- 815 W Harwood Rd Unit A
- 821 W Harwood Rd Unit B
- 821 W Harwood Rd Unit E
- 821 W Harwood Rd Unit D
- 821 W Harwood Rd Unit A
- 821 W Harwood Rd Unit C
- 835 W Harwood Rd Unit A
- 835 W Harwood Rd Unit D
- 835 W Harwood Rd Unit E
- 835 W Harwood Rd Unit C
- 835 W Harwood Rd Unit B
- 833 W Harwood Rd Unit E
- 833 W Harwood Rd Unit F
- 833 W Harwood Rd Unit D