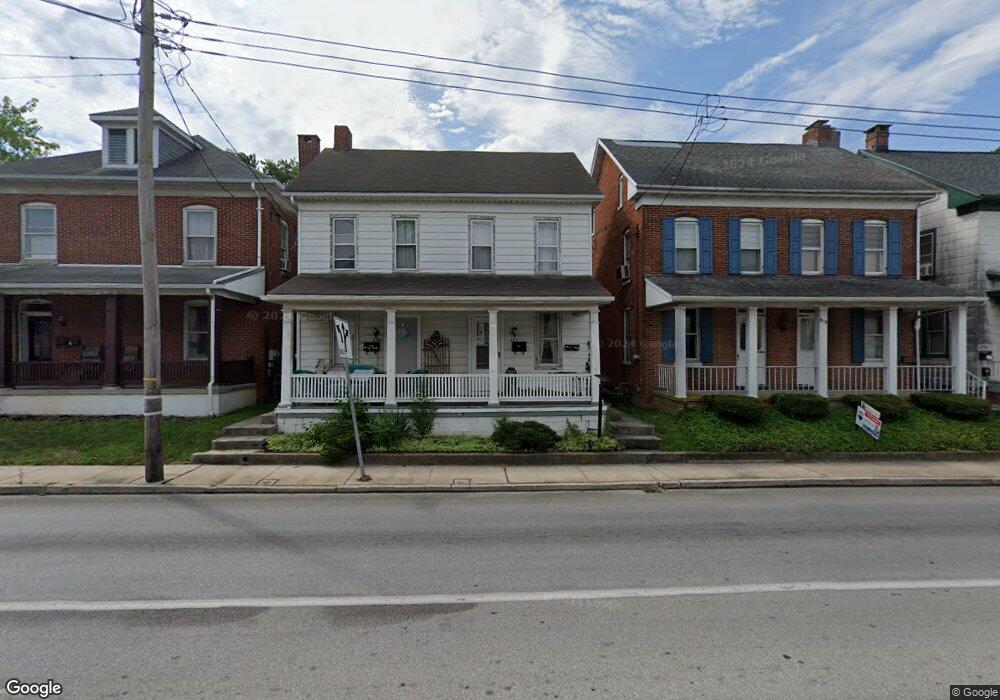
817 York St Hanover, PA 17331
Estimated Value: $186,000 - $250,000
4
Beds
2
Baths
1,378
Sq Ft
$155/Sq Ft
Est. Value
About This Home
This home is located at 817 York St, Hanover, PA 17331 and is currently estimated at $213,151, approximately $154 per square foot. 817 York St is a home located in York County with nearby schools including South Western Senior High School and Delone Catholic High School.
Ownership History
Date
Name
Owned For
Owner Type
Purchase Details
Closed on
Sep 20, 2019
Sold by
Ivgi Shai
Bought by
Allison Thomas L and Allison Rhonda L
Current Estimated Value
Home Financials for this Owner
Home Financials are based on the most recent Mortgage that was taken out on this home.
Original Mortgage
$142,250
Outstanding Balance
$124,600
Interest Rate
3.6%
Mortgage Type
Commercial
Estimated Equity
$88,551
Purchase Details
Closed on
May 28, 2019
Sold by
Ivgi Jessica
Bought by
Ivgi Shai
Purchase Details
Closed on
Feb 23, 2012
Sold by
Halter Richard W and Halter William E
Bought by
Ivgi Shai and Ivgi Jessica
Home Financials for this Owner
Home Financials are based on the most recent Mortgage that was taken out on this home.
Original Mortgage
$300,000
Interest Rate
3.88%
Mortgage Type
Unknown
Purchase Details
Closed on
Jul 27, 2004
Sold by
Halter Garland W and Halter Alice E
Bought by
Halter Garland W
Create a Home Valuation Report for This Property
The Home Valuation Report is an in-depth analysis detailing your home's value as well as a comparison with similar homes in the area
Home Values in the Area
Average Home Value in this Area
Purchase History
| Date | Buyer | Sale Price | Title Company |
|---|---|---|---|
| Allison Thomas L | $139,000 | Quality Svc Settlments Llc | |
| Ivgi Shai | -- | None Available | |
| Ivgi Shai | $265,000 | None Available | |
| Halter Garland W | -- | -- |
Source: Public Records
Mortgage History
| Date | Status | Borrower | Loan Amount |
|---|---|---|---|
| Open | Allison Thomas L | $142,250 | |
| Previous Owner | Ivgi Shai | $300,000 |
Source: Public Records
Tax History Compared to Growth
Tax History
| Year | Tax Paid | Tax Assessment Tax Assessment Total Assessment is a certain percentage of the fair market value that is determined by local assessors to be the total taxable value of land and additions on the property. | Land | Improvement |
|---|---|---|---|---|
| 2025 | $2,540 | $75,370 | $26,240 | $49,130 |
| 2024 | $2,540 | $75,370 | $26,240 | $49,130 |
| 2023 | $2,495 | $75,370 | $26,240 | $49,130 |
| 2022 | $2,441 | $75,370 | $26,240 | $49,130 |
| 2021 | $2,308 | $75,370 | $26,240 | $49,130 |
| 2020 | $2,308 | $75,370 | $26,240 | $49,130 |
| 2019 | $2,263 | $75,370 | $26,240 | $49,130 |
| 2018 | $2,233 | $75,370 | $26,240 | $49,130 |
| 2017 | $2,182 | $75,370 | $26,240 | $49,130 |
| 2016 | $0 | $75,370 | $26,240 | $49,130 |
| 2015 | -- | $75,370 | $26,240 | $49,130 |
| 2014 | -- | $75,370 | $26,240 | $49,130 |
Source: Public Records
Map
Nearby Homes
- 814 York St
- 28 Brookside Ave
- 501 Charles Ave
- 216 Charles Ave
- 538 Baer Ave
- 208 Overlook Dr
- 8 Fair Ave
- 37 Coop Ln
- 103 Overlook Dr
- 525 Locust St
- 138 Center Rear St
- 320 Spring Ave
- 183 Center St Unit 183
- 194 Center St Unit 194
- 930 York St
- 273 Locust St
- 324 Pleasant St
- 612 Cypress Dr Unit 51
- 132 Mcallister St
- 553 Mcallister St
- 817 and 81 York St
- 817 and 81 York St
- 817 York St
- 817,817A&B York St
- 813 York St Unit 813 1/2
- 819 & 819 York St
- 819 8191/2 York St
- 819 & 819 1/2 York St
- 819 York St
- 819.5 York St
- 819 York St
- 10 S Center St
- 811 York St
- 811 York St
- 24 S Center
- 816 York St
- 23 S Center St
- 820 York St
- 818 York St
- 809 York St