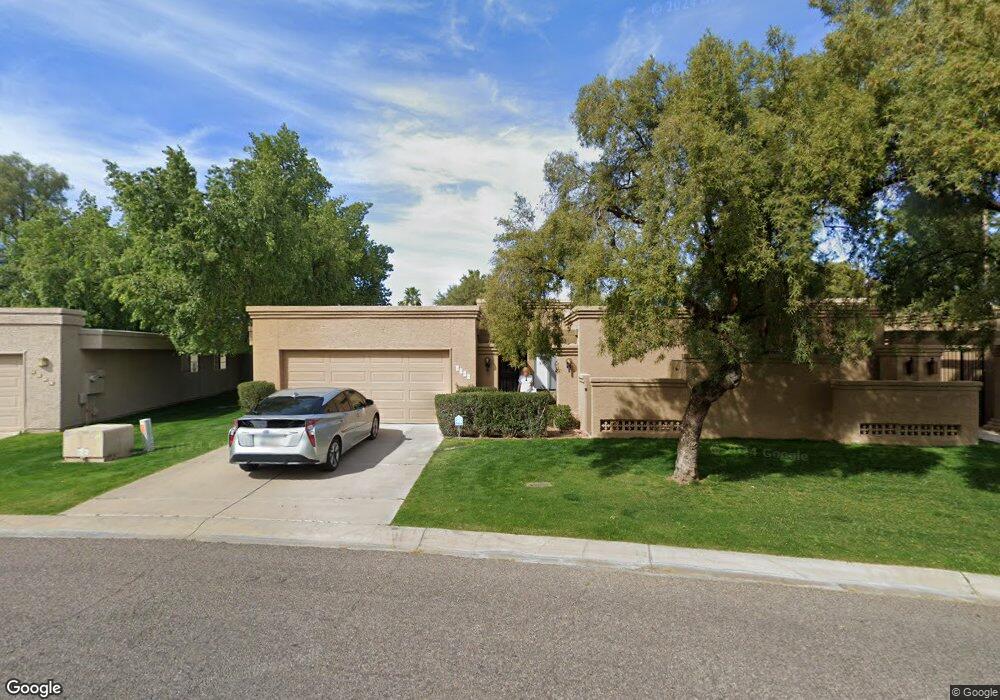
8170 E Del Laton Dr Scottsdale, AZ 85258
McCormick Ranch NeighborhoodEstimated Value: $539,000 - $825,000
3
Beds
2
Baths
1,930
Sq Ft
$353/Sq Ft
Est. Value
About This Home
This home is located at 8170 E Del Laton Dr, Scottsdale, AZ 85258 and is currently estimated at $681,357, approximately $353 per square foot. 8170 E Del Laton Dr is a home located in Maricopa County with nearby schools including Cochise Elementary School, Cocopah Middle School, and Chaparral High School.
Ownership History
Date
Name
Owned For
Owner Type
Purchase Details
Closed on
Nov 15, 2023
Sold by
Feldman Ira and Feldman Mary E
Bought by
Feldman Ira C and Feldman Mary E
Current Estimated Value
Purchase Details
Closed on
Nov 1, 2023
Sold by
Feldman Ira and Feldman Mary E
Bought by
Feldman Ira C and Feldman Mary E
Purchase Details
Closed on
Oct 16, 2020
Sold by
Feldman Ira C
Bought by
Yeager Mary E and Feldman Ira C
Purchase Details
Closed on
Jul 1, 2019
Sold by
Gerschel Philippe
Bought by
Feldman Ira
Purchase Details
Closed on
Apr 20, 2006
Sold by
Gerschel Alberta
Bought by
Feldman Rachel
Purchase Details
Closed on
Nov 1, 1999
Sold by
Gerschel Laurence
Bought by
Gerschel Alberta
Purchase Details
Closed on
Oct 27, 1999
Sold by
Feldman Rachel
Bought by
Feldman Rachel and Gerschel Alberta
Purchase Details
Closed on
Aug 24, 1999
Sold by
Feldman Sol
Bought by
Feldman Rachel
Create a Home Valuation Report for This Property
The Home Valuation Report is an in-depth analysis detailing your home's value as well as a comparison with similar homes in the area
Home Values in the Area
Average Home Value in this Area
Purchase History
| Date | Buyer | Sale Price | Title Company |
|---|---|---|---|
| Feldman Ira C | $240,000 | None Listed On Document | |
| Feldman Ira C | $240,000 | None Listed On Document | |
| Yeager Mary E | $240,000 | None Available | |
| Feldman Ira | -- | None Available | |
| Feldman Rachel | -- | None Available | |
| Gerschel Alberta | -- | -- | |
| Feldman Rachel | -- | -- | |
| Feldman Rachel | -- | -- | |
| Feldman Rachel | -- | -- |
Source: Public Records
Tax History Compared to Growth
Tax History
| Year | Tax Paid | Tax Assessment Tax Assessment Total Assessment is a certain percentage of the fair market value that is determined by local assessors to be the total taxable value of land and additions on the property. | Land | Improvement |
|---|---|---|---|---|
| 2025 | $2,275 | $37,910 | -- | -- |
| 2024 | $2,132 | $36,105 | -- | -- |
| 2023 | $2,132 | $49,030 | $9,800 | $39,230 |
| 2022 | $2,031 | $38,670 | $7,730 | $30,940 |
| 2021 | $2,202 | $36,420 | $7,280 | $29,140 |
| 2020 | $2,551 | $34,210 | $6,840 | $27,370 |
| 2019 | $2,465 | $32,630 | $6,520 | $26,110 |
| 2018 | $2,386 | $29,710 | $5,940 | $23,770 |
| 2017 | $2,285 | $28,150 | $5,630 | $22,520 |
| 2016 | $2,242 | $26,960 | $5,390 | $21,570 |
| 2015 | $2,133 | $28,320 | $5,660 | $22,660 |
Source: Public Records
Map
Nearby Homes
- 8935 N 82nd St
- 9027 N 82nd St
- 8925 N 83rd St
- 8151 E Del Joya Dr
- 8184 E Del Cuarzo Dr
- 8162 E Del Cuarzo Dr
- 8107 E Del Caverna Dr
- 9220 N 83rd St
- 8919 N 80th Place
- 9031 N 83rd Way
- 8542 E San Bernardo Dr
- 9175 N 82nd St
- 8166 E Del Cadena Dr
- 8936 N 80th Place
- 8356 E San Ricardo Dr
- 8107 E Del Cuarzo Dr
- 9225 N 83rd Way
- 9372 N 83rd St
- 8302 E San Salvador Dr
- 8713 N 80th Place
- 8150 E Del Laton Dr
- 8130 E Del Laton Dr
- 8145 E Del Laton Dr
- 8180 E Del Marino
- 8143 E Del Laton Dr
- 8971 N 81st St
- 8971 N 81st St
- 8955 N 82nd St
- 8139 E Del Laton Dr
- 8096 E Del Laton Dr
- 13330 E Via Linda #1058 Dr
- 8945 N 82nd St
- 9039 N 82nd St
- 8092 E Del Laton Dr
- 8137 E Del Laton Dr
- 8991 N 81st St
- 9015 N 82nd St
- 8966 N 81st St
- 8195 E Del Marino
- 8185 E Del Marino Dr