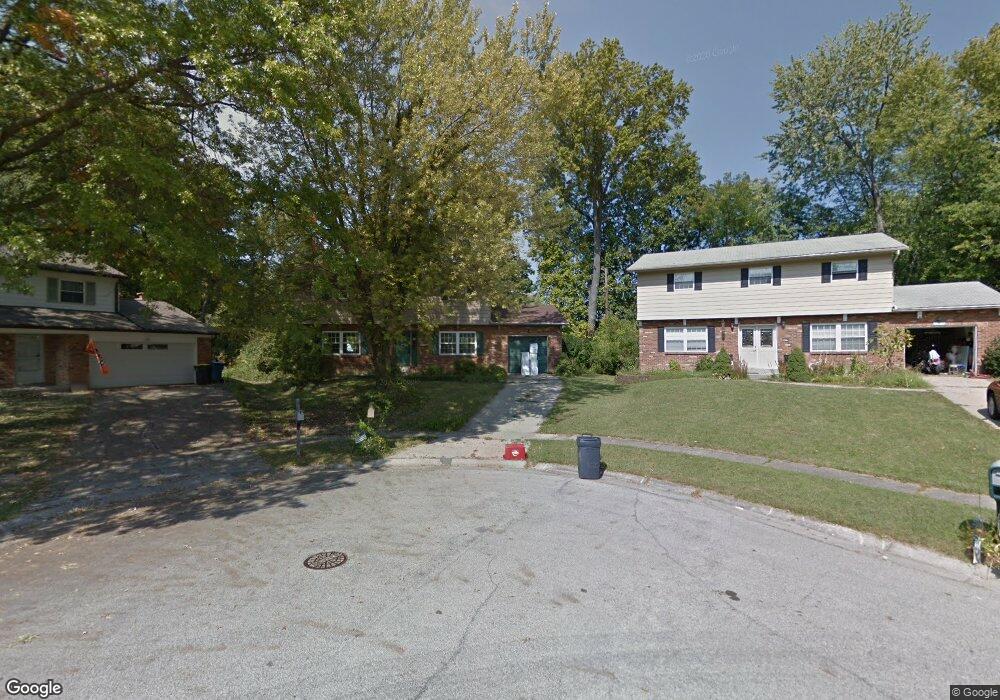
8172 Bonanza Ln Cincinnati, OH 45255
Estimated Value: $353,529 - $363,000
4
Beds
3
Baths
1,813
Sq Ft
$198/Sq Ft
Est. Value
About This Home
This home is located at 8172 Bonanza Ln, Cincinnati, OH 45255 and is currently estimated at $359,382, approximately $198 per square foot. 8172 Bonanza Ln is a home located in Hamilton County with nearby schools including Summit Elementary School, Nagel Middle School, and Anderson High School.
Ownership History
Date
Name
Owned For
Owner Type
Purchase Details
Closed on
Mar 31, 2015
Sold by
Roumegoux Aude Scheibli
Bought by
Hurley Ericka F and Hurley Christopher J
Current Estimated Value
Home Financials for this Owner
Home Financials are based on the most recent Mortgage that was taken out on this home.
Original Mortgage
$169,159
Outstanding Balance
$128,757
Interest Rate
3.75%
Mortgage Type
FHA
Estimated Equity
$230,625
Purchase Details
Closed on
Sep 16, 2009
Sold by
Leopold James H and Leopold Kathy J
Bought by
Roumegoux Aude Scheibli and Roumegoux Frederic
Home Financials for this Owner
Home Financials are based on the most recent Mortgage that was taken out on this home.
Original Mortgage
$183,120
Interest Rate
5.32%
Mortgage Type
FHA
Create a Home Valuation Report for This Property
The Home Valuation Report is an in-depth analysis detailing your home's value as well as a comparison with similar homes in the area
Home Values in the Area
Average Home Value in this Area
Purchase History
| Date | Buyer | Sale Price | Title Company |
|---|---|---|---|
| Hurley Ericka F | $175,000 | Cincinnatus Title | |
| Roumegoux Aude Scheibli | -- | Cincinnatus Title | |
| Roumegoux Aude Scheibli | $186,500 | Attorney |
Source: Public Records
Mortgage History
| Date | Status | Borrower | Loan Amount |
|---|---|---|---|
| Open | Hurley Ericka F | $169,159 | |
| Previous Owner | Roumegoux Aude Scheibli | $183,120 |
Source: Public Records
Tax History
| Year | Tax Paid | Tax Assessment Tax Assessment Total Assessment is a certain percentage of the fair market value that is determined by local assessors to be the total taxable value of land and additions on the property. | Land | Improvement |
|---|---|---|---|---|
| 2025 | $6,525 | $104,213 | $15,971 | $88,242 |
| 2023 | $6,035 | $104,213 | $15,971 | $88,242 |
| 2022 | $4,505 | $69,213 | $13,881 | $55,332 |
| 2021 | $4,403 | $69,213 | $13,881 | $55,332 |
| 2020 | $4,448 | $69,213 | $13,881 | $55,332 |
| 2019 | $4,338 | $61,250 | $12,285 | $48,965 |
| 2018 | $4,065 | $61,250 | $12,285 | $48,965 |
| 2017 | $3,837 | $61,250 | $12,285 | $48,965 |
| 2016 | $4,101 | $63,970 | $12,040 | $51,930 |
| 2015 | $3,981 | $63,970 | $12,040 | $51,930 |
| 2014 | $3,983 | $63,970 | $12,040 | $51,930 |
| 2013 | $3,845 | $65,275 | $12,285 | $52,990 |
Source: Public Records
Map
Nearby Homes
- 1885 Wanninger Ln
- 1847 Eight Mile Rd
- 1748 Hilltree Dr
- 7926 Dunview Ct
- 7660 Clough Pike
- 7652 Clough Pike
- 8146 Clough Pike
- 1662 Hilltree Dr
- 8096 Pineterrace Dr
- 8022 Stonegate Dr
- 1400 Sigma Cir
- 1363 Oak Ct
- 1357 Oak Ct
- 1333 Eight Mile Rd
- 1858 Foxhollow Dr
- 1251 Eight Mile Rd
- 1676 Laval Dr
- 1502 Huntcrest Dr
- 8175 Timbercreek Dr
- 8602 Linderwood Ln
- 1699 Vaquera Place
- 8178 Bonanza Ln
- 1693 Vaquera Place
- 8184 Bonanza Ln
- 1687 Vaquera Place
- 8181 Bonanza Ln
- 1717 Yellowglen Dr
- 1681 Vaquera Place
- 1722 Wanninger Ln
- 1729 Yellowglen Dr
- 1711 Yellowglen Dr
- 1682 Vaquera Place
- 1702 Wanninger Ln
- 1744 Wanninger Ln
- 1675 Vaquera Place
- 1743 Yellowglen Dr
- 1676 Vaquera Place
- 1681 Yellowglen Dr
- 1758 Wanninger Ln
- 1669 Vaquera Place
Your Personal Tour Guide
Ask me questions while you tour the home.