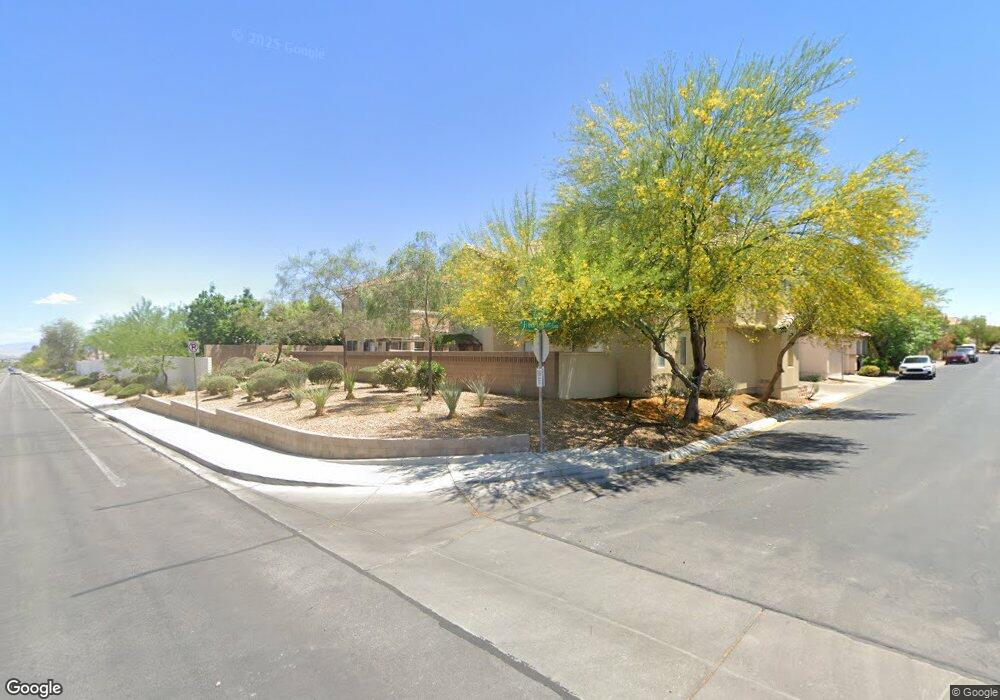
8176 Finch Feather St Unit 91 Las Vegas, NV 89143
Kyle Canyon NeighborhoodEstimated Value: $375,000 - $392,551
4
Beds
3
Baths
1,572
Sq Ft
$246/Sq Ft
Est. Value
About This Home
This home is located at 8176 Finch Feather St Unit 91, Las Vegas, NV 89143 and is currently estimated at $386,638, approximately $245 per square foot. 8176 Finch Feather St Unit 91 is a home located in Clark County with nearby schools including James Bilbray Elementary School, William & Mary Scherkenbach Elementary School, and Ralph Cadwallader Middle School.
Ownership History
Date
Name
Owned For
Owner Type
Purchase Details
Closed on
Apr 15, 2024
Sold by
Holloway Timothy
Bought by
Timothy Holloway Revocable Living Trust and Holloway
Current Estimated Value
Purchase Details
Closed on
Feb 3, 2005
Sold by
Holloway Timothy
Bought by
Holloway Tim
Home Financials for this Owner
Home Financials are based on the most recent Mortgage that was taken out on this home.
Original Mortgage
$218,075
Interest Rate
5.5%
Mortgage Type
New Conventional
Purchase Details
Closed on
May 28, 2004
Sold by
Richmond American Homes Of Nevada
Bought by
Holloway Timothy
Home Financials for this Owner
Home Financials are based on the most recent Mortgage that was taken out on this home.
Original Mortgage
$216,900
Interest Rate
5.86%
Mortgage Type
Unknown
Create a Home Valuation Report for This Property
The Home Valuation Report is an in-depth analysis detailing your home's value as well as a comparison with similar homes in the area
Home Values in the Area
Average Home Value in this Area
Purchase History
| Date | Buyer | Sale Price | Title Company |
|---|---|---|---|
| Timothy Holloway Revocable Living Trust | -- | None Listed On Document | |
| Holloway Tim | -- | Chicago Title | |
| Holloway Timothy | $216,925 | United Title Of Nevada |
Source: Public Records
Mortgage History
| Date | Status | Borrower | Loan Amount |
|---|---|---|---|
| Previous Owner | Holloway Tim | $218,075 | |
| Previous Owner | Holloway Timothy | $216,900 |
Source: Public Records
Tax History Compared to Growth
Tax History
| Year | Tax Paid | Tax Assessment Tax Assessment Total Assessment is a certain percentage of the fair market value that is determined by local assessors to be the total taxable value of land and additions on the property. | Land | Improvement |
|---|---|---|---|---|
| 2025 | $1,774 | $92,061 | $27,300 | $64,761 |
| 2024 | $1,644 | $92,061 | $27,300 | $64,761 |
| 2023 | $1,644 | $90,209 | $29,050 | $61,159 |
| 2022 | $1,522 | $79,594 | $23,800 | $55,794 |
| 2021 | $1,410 | $74,029 | $21,000 | $53,029 |
| 2020 | $1,306 | $72,851 | $20,300 | $52,551 |
| 2019 | $1,224 | $68,042 | $16,450 | $51,592 |
| 2018 | $1,168 | $63,054 | $13,650 | $49,404 |
| 2017 | $2,017 | $61,441 | $11,550 | $49,891 |
| 2016 | $1,094 | $48,039 | $8,750 | $39,289 |
| 2015 | $1,091 | $38,843 | $7,000 | $31,843 |
| 2014 | $1,057 | $32,797 | $7,000 | $25,797 |
Source: Public Records
Map
Nearby Homes
- 9028 Medicine Wheel Ave
- 9053 Starling Wing Place
- 9065 Starling Wing Place Unit 91
- 9061 Starling Wing Place
- 9104 Spoonbill Ridge Place
- 8908 Happy Stream Ave
- 8920 Iron Hitch Ave
- 8248 Apple Spice St
- 8301 Strawberry Spring St
- 8877 Happy Stream Ave
- 9181 Wild Briar Ln
- 9117 Watermelon Seed Ave
- 9177 Bright Blue Sky Ave
- 8717 Radiant Ruby Ave Unit 1
- 8913 Picket Fence Ave
- 8421 Winterchase Place
- 8728 Burning Hide Ave Unit 1
- 8812 Pine Pitch Dr
- 7810 Eastern Elk St
- 9143 Sea Mink Ave
- 8180 Finch Feather St Unit 999
- 8180 Finch Feather St
- 8180 Finch Feather St Unit 9999
- 9032 Medicine Wheel Ave
- 8172 Finch Feather St
- 8172 Finch Feather St Unit n/a
- 8168 Finch Feather St
- 8160 Finch Feather St
- 8164 Finch Feather St
- 9024 Medicine Wheel Ave
- 9052 Starling Wing Place Unit 91
- 9052 Starling Wing Place
- 9048 Starling Wing Place
- 9048 Starling Wing Place
- 9048 Starling Wing Place Unit na
- 8156 Finch Feather St
- 8156 Finch Feather St Unit n/a
- 8201 Harvest Spring Place Unit 1
- 8201 Harvest Spring Place
- 9020 Medicine Wheel Ave