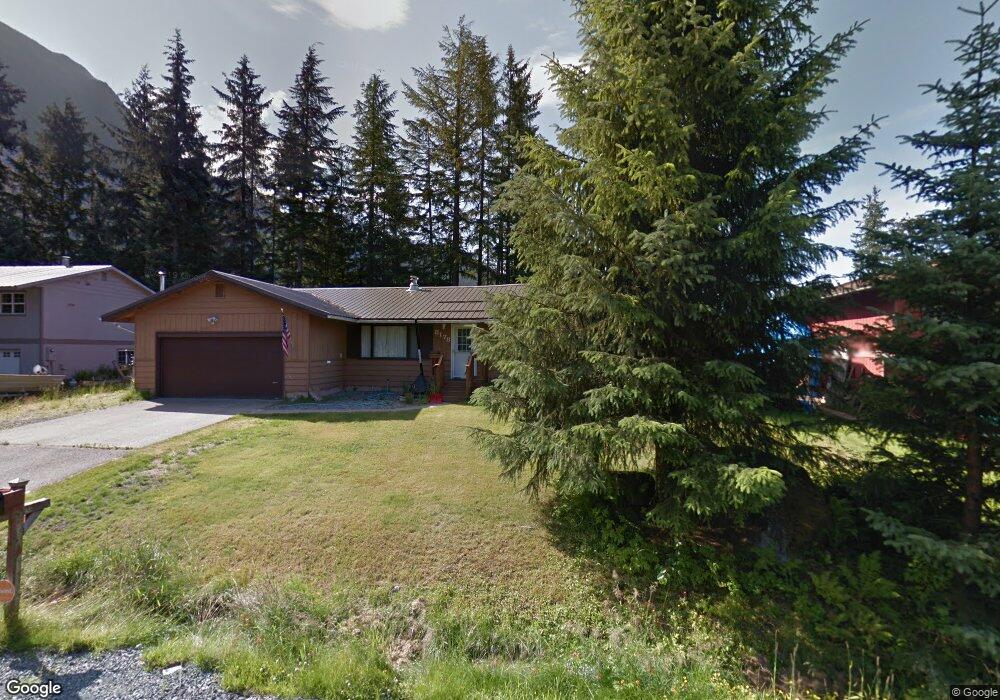
8178 Grant St Juneau, AK 99801
Mendenhall Valley NeighborhoodEstimated Value: $117,000 - $520,422
3
Beds
2
Baths
1,489
Sq Ft
$270/Sq Ft
Est. Value
About This Home
This home is located at 8178 Grant St, Juneau, AK 99801 and is currently estimated at $401,606, approximately $269 per square foot. 8178 Grant St is a home located in Juneau City and Borough with nearby schools including Glacier Valley Elementary School.
Ownership History
Date
Name
Owned For
Owner Type
Purchase Details
Closed on
Sep 10, 2012
Sold by
Lee Felix C and Lee Jennifer Hope
Bought by
Lee Felix C and Lee Jennifer Hope
Current Estimated Value
Home Financials for this Owner
Home Financials are based on the most recent Mortgage that was taken out on this home.
Original Mortgage
$252,592
Outstanding Balance
$174,205
Interest Rate
3.5%
Mortgage Type
FHA
Estimated Equity
$227,401
Purchase Details
Closed on
Sep 29, 2008
Sold by
Diekmann Chad and Diekmann Allison
Bought by
Lee Felix C and Maller Jennifer H
Home Financials for this Owner
Home Financials are based on the most recent Mortgage that was taken out on this home.
Original Mortgage
$264,343
Interest Rate
6.43%
Mortgage Type
FHA
Purchase Details
Closed on
Sep 11, 2002
Sold by
Cikler Kenneth R and Cikler Ann Marie
Bought by
Diekmann Chad and Diekmann Allison
Home Financials for this Owner
Home Financials are based on the most recent Mortgage that was taken out on this home.
Original Mortgage
$191,987
Interest Rate
6.37%
Mortgage Type
FHA
Create a Home Valuation Report for This Property
The Home Valuation Report is an in-depth analysis detailing your home's value as well as a comparison with similar homes in the area
Home Values in the Area
Average Home Value in this Area
Purchase History
| Date | Buyer | Sale Price | Title Company |
|---|---|---|---|
| Lee Felix C | -- | First American Title Ins Co | |
| Lee Felix C | -- | Title Insurance Agency | |
| Diekmann Chad | -- | First American Title |
Source: Public Records
Mortgage History
| Date | Status | Borrower | Loan Amount |
|---|---|---|---|
| Open | Lee Felix C | $252,592 | |
| Closed | Lee Felix C | $264,343 | |
| Previous Owner | Diekmann Chad | $191,987 |
Source: Public Records
Tax History Compared to Growth
Tax History
| Year | Tax Paid | Tax Assessment Tax Assessment Total Assessment is a certain percentage of the fair market value that is determined by local assessors to be the total taxable value of land and additions on the property. | Land | Improvement |
|---|---|---|---|---|
| 2025 | $4,606 | $449,800 | $127,600 | $322,200 |
| 2024 | $4,542 | $452,400 | $127,600 | $324,800 |
| 2023 | $4,662 | $458,900 | $127,600 | $331,300 |
| 2022 | $4,279 | $405,200 | $124,100 | $281,100 |
| 2021 | $3,908 | $370,100 | $124,100 | $246,000 |
| 2020 | $3,867 | $362,800 | $124,100 | $238,700 |
| 2019 | $3,736 | $350,500 | $124,100 | $226,400 |
| 2018 | $3,362 | $349,600 | $126,000 | $223,600 |
| 2017 | $3,362 | $345,500 | $126,000 | $219,500 |
| 2016 | $3,362 | $315,342 | $98,477 | $216,865 |
| 2015 | -- | $300,326 | $93,788 | $206,538 |
| 2014 | -- | $293,000 | $91,500 | $201,500 |
Source: Public Records
Map
Nearby Homes
- 4356 Manor Ave
- 8118 Easy St
- 0 Garnet St
- 8477 Thunder Mountain Mhp Unit Sp 87
- 8477 Thunder Mountain Rd Unit SP 63
- 8477 Thunder Mountain Rd Unit Lot 77
- 8477 Thunder Mountain Rd Unit SP 89
- 4478 Kanat'A Deyi St
- 4478 Kanat'A St
- 8274 Garnet St
- 4128 Taku Blvd
- 4090 Delta Dr Unit 7
- 4090 Delta Dr Unit 8
- 4195 Taku Blvd
- 4353 Taku Blvd
- 4494 Chelsea Ct
- 4374 Taku Blvd
- 4416 Mint Way
- 4409 Mint Way
- 4403 Taku Blvd