Estimated Value: $732,338
--
Bed
--
Bath
1,627
Sq Ft
$450/Sq Ft
Est. Value
About This Home
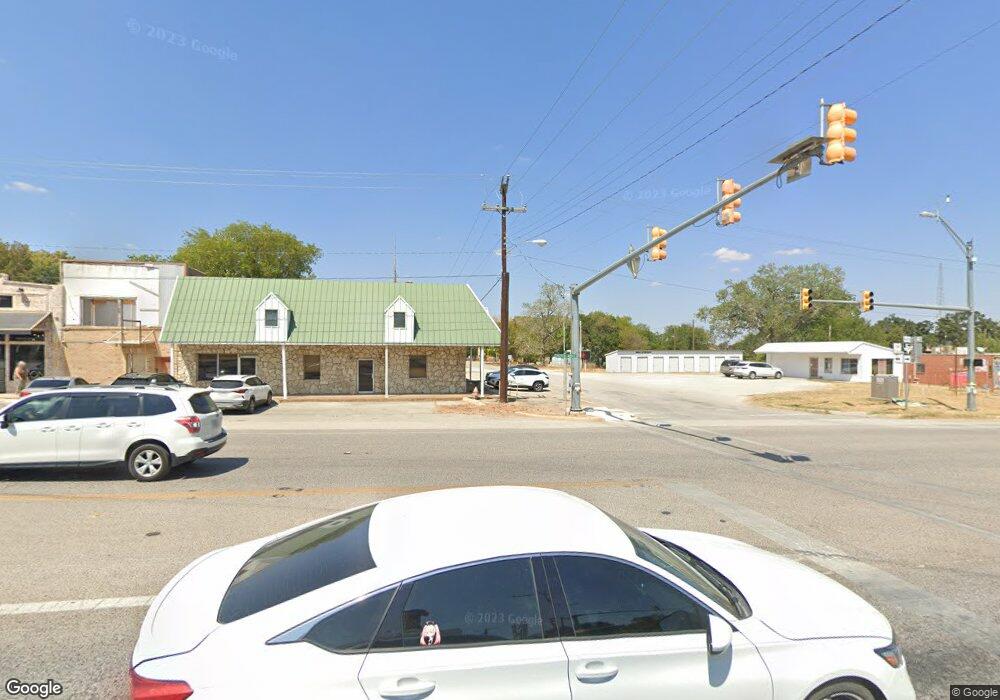
This home is located at 8179 Fm 2123, Boyd, TX 76023 and is currently estimated at $732,338, approximately $450 per square foot. 8179 Fm 2123 is a home located in Wise County with nearby schools including Paradise Elementary School, Paradise Intermediate School, and Paradise Junior High School.
Ownership History
Date
Name
Owned For
Owner Type
Purchase Details
Closed on
Dec 18, 2020
Sold by
Franks Darrell J
Bought by
Merlino Debra
Current Estimated Value
Purchase Details
Closed on
Dec 16, 2019
Sold by
Franks Karen L
Bought by
Franks Darrell J
Purchase Details
Closed on
Sep 4, 2018
Sold by
Masters Family Farm Llc
Bought by
Franks Darrell J and Franks Karen L
Purchase Details
Closed on
Dec 2, 2015
Sold by
Lunamar Properties Llc
Bought by
Masters Family Farm Llc
Purchase Details
Closed on
Jan 30, 2015
Sold by
Bennett Rhonda J and Jackson Karen L
Bought by
Lunamar Properties Llc
Home Financials for this Owner
Home Financials are based on the most recent Mortgage that was taken out on this home.
Original Mortgage
$724,774
Interest Rate
3.83%
Mortgage Type
Purchase Money Mortgage
Purchase Details
Closed on
Jan 1, 1901
Bought by
Masters Family Farm Llc
Create a Home Valuation Report for This Property
The Home Valuation Report is an in-depth analysis detailing your home's value as well as a comparison with similar homes in the area
Home Values in the Area
Average Home Value in this Area
Purchase History
| Date | Buyer | Sale Price | Title Company |
|---|---|---|---|
| Merlino Debra | -- | Capital Title | |
| Franks Darrell J | -- | None Available | |
| Franks Darrell J | -- | None Available | |
| Masters Family Farm Llc | -- | -- | |
| Lunamar Properties Llc | $724,774 | None Available | |
| Masters Family Farm Llc | -- | -- |
Source: Public Records
Mortgage History
| Date | Status | Borrower | Loan Amount |
|---|---|---|---|
| Previous Owner | Lunamar Properties Llc | $724,774 |
Source: Public Records
Tax History Compared to Growth
Tax History
| Year | Tax Paid | Tax Assessment Tax Assessment Total Assessment is a certain percentage of the fair market value that is determined by local assessors to be the total taxable value of land and additions on the property. | Land | Improvement |
|---|---|---|---|---|
| 2025 | $5,512 | $385,152 | $38,044 | $347,108 |
| 2024 | $5,512 | $366,456 | $37,936 | $328,520 |
| 2023 | $5,245 | $376,181 | $0 | $0 |
| 2022 | $5,050 | $323,525 | $0 | $0 |
| 2021 | $4,728 | $563,510 | $306,250 | $257,260 |
| 2020 | $8,283 | $495,010 | $247,500 | $247,510 |
| 2019 | $4,431 | $489,230 | $247,500 | $241,730 |
| 2018 | $4,210 | $438,060 | $210,370 | $227,690 |
| 2017 | $75 | $190,690 | $187,500 | $3,190 |
| 2016 | $76 | $178,220 | $175,000 | $3,220 |
| 2015 | -- | $135,320 | $82,110 | $53,210 |
| 2014 | -- | $50,590 | $3,690 | $46,900 |
Source: Public Records
Map
Nearby Homes
- 179 Private Road 4590
- 110 Brush Creek Dr
- 106 Brush Creek Dr
- The Salado Plan at Saddleback Estates
- 211 Cr-4690
- 126 Lula Ln
- 891 County Road 3592
- 204 Blackjack Crossing
- 191 Lucky Ridge Ln
- 209 Blackjack Crossing
- TBD County Road 3592
- 178 Private Rd
- 0000 County Road 4698
- 125 Lucky Ridge Ln
- 820 County Road 3592
- 271 County Road 3480
- 719 County Road 3355
- 1290 County Road 3355
- 702 County Road 3597
- 1249 County Road 4680
- 8179 Fm 2123
- 8179 Fm 2123
- 8099 Fm 2123
- 8178 Fm 2123
- 8179 Fm 2123
- 8096 Fm 2123
- 8096 Fm 2123
- 8238 Fm 2123
- 8238 Fm 2123
- 197 Pr 4590
- 197 Pr 4590
- 197 Private Road 4590
- 178 Private Road 4590
- 165 Private Road 4590
- 196 Private Road 4590
- 132 Private Road 3576
- 132 Private Road 3576
- 160 Private Road 4590
- 161 Private Road 4590
- 146 Private Road 3576