A
Seller's Agent in 2015
Ann Thomas
Frison Realty & Construction Co
(229) 347-2457
45 Total Sales

Estimated Value: $85,000 - $107,000
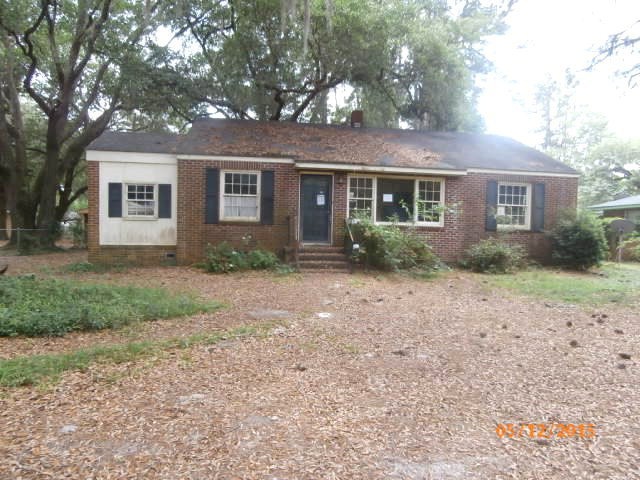
Good location. With some TLC would make nice home or investment property.Large rear yard for all family gatherings.
Last Agent to Sell the Property
Frison Realty & Construction Co Brokerage Phone: 2294366628 License #43940 Listed on: 06/03/2015
Last Buyer's Agent
Frison Realty & Construction Co Brokerage Phone: 2294366628 License #43940 Listed on: 06/03/2015
| Date | Buyer | Sale Price | Title Company |
|---|---|---|---|
| Gardner Alison | -- | -- | |
| Brown Sirlena E | $20,000 | -- | |
| Suntrust Bank | -- | -- | |
| Houston Michelle A | -- | -- | |
| Albert Michelle | $60,000 | -- | |
| Pelham Charles W | $32,500 | -- | |
| Norris David O Etal | $39,700 | -- |
| Date | Status | Borrower | Loan Amount |
|---|---|---|---|
| Previous Owner | Houston Michelle A | $62,200 |
| Date | Event | Price | List to Sale | Price per Sq Ft |
|---|---|---|---|---|
| 06/26/2015 06/26/15 | Sold | $20,000 | -- | $17 / Sq Ft |
| 06/03/2015 06/03/15 | Pending | -- | -- | -- |
| Year | Tax Paid | Tax Assessment Tax Assessment Total Assessment is a certain percentage of the fair market value that is determined by local assessors to be the total taxable value of land and additions on the property. | Land | Improvement |
|---|---|---|---|---|
| 2025 | $1,173 | $23,156 | $7,040 | $16,116 |
| 2024 | $1,173 | $22,800 | $7,040 | $15,760 |
| 2023 | $1,062 | $22,800 | $7,040 | $15,760 |
| 2022 | $1,066 | $22,800 | $7,040 | $15,760 |
| 2021 | $988 | $22,800 | $7,040 | $15,760 |
| 2020 | $991 | $22,800 | $7,040 | $15,760 |
| 2019 | $995 | $22,800 | $7,040 | $15,760 |
| 2018 | $999 | $22,800 | $7,040 | $15,760 |
| 2017 | $930 | $22,800 | $7,040 | $15,760 |
| 2016 | $327 | $22,800 | $7,040 | $15,760 |
| 2015 | $852 | $22,800 | $7,040 | $15,760 |
| 2014 | $855 | $23,160 | $7,400 | $15,760 |
A
Seller's Agent in 2015
Ann Thomas
Frison Realty & Construction Co
(229) 347-2457
45 Total Sales
Source: Albany Board of REALTORS®
MLS Number: 133907
APN: 000LL-00029-021
Ask me questions while you tour the home.
