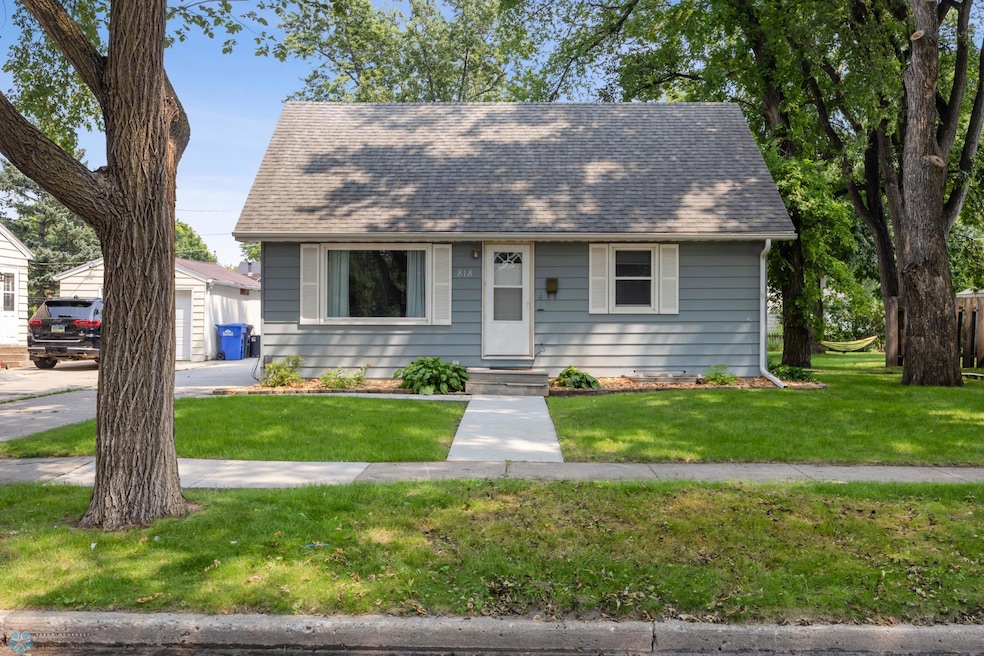
818 19th St S Fargo, ND 58103
Jefferson-Carl NeighborhoodEstimated payment $1,582/month
Highlights
- No HOA
- Living Room
- Forced Air Heating and Cooling System
- Stainless Steel Appliances
- Laundry Room
- Utility Room
About This Home
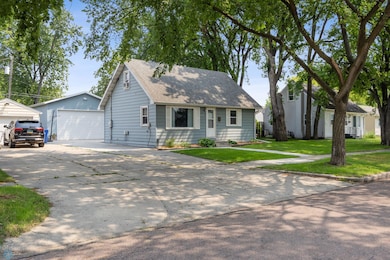
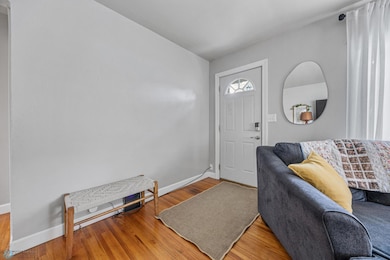
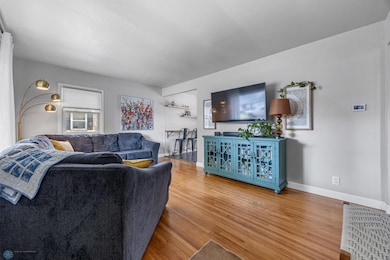
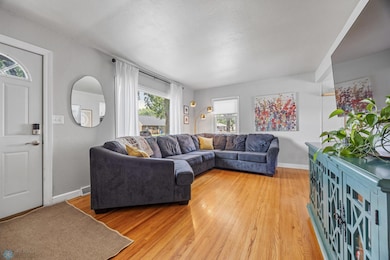
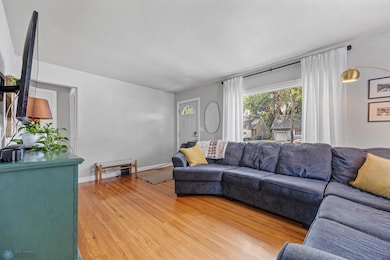
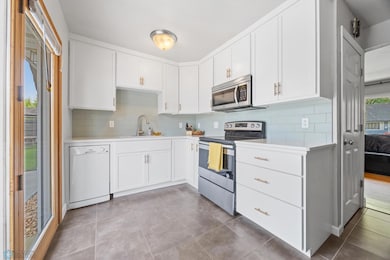
This 3 bedroom 1 bathroom South Fargo home near Carl Ben elementary. The main floor features original hardwood floors, and a updated kitchen. The 2 bedrooms and updated bathroom on the main floor complete the cozy space! The upstairs offers a spacious third bedroom, plenty of room with built in storage, and a great multi-use space! Enjoy the newly finished basement family room. Along with a spacious 24' x 36' finished detached garage with a oversized door, and a built-in heater—perfect for year-round projects, storage, or a dream workshop.
Home Details
Home Type
- Single Family
Est. Annual Taxes
- $2,827
Year Built
- Built in 1953
Lot Details
- 6,795 Sq Ft Lot
- Lot Dimensions are 58 x 118
Parking
- 2 Car Garage
- Shared Driveway
Home Design
- Architectural Shingle Roof
- Steel Siding
Interior Spaces
- 1.5-Story Property
- Family Room
- Living Room
- Utility Room
- Partially Finished Basement
Kitchen
- Range
- Microwave
- Stainless Steel Appliances
Bedrooms and Bathrooms
- 3 Bedrooms
- 1 Full Bathroom
Laundry
- Laundry Room
- Dryer
- Washer
Utilities
- Forced Air Heating and Cooling System
- Electric Water Heater
Community Details
- No Home Owners Association
- Lauries Sub Hilleboe Terrace Subdivision
Listing and Financial Details
- Assessor Parcel Number 01170000220000
Map
Home Values in the Area
Average Home Value in this Area
Tax History
| Year | Tax Paid | Tax Assessment Tax Assessment Total Assessment is a certain percentage of the fair market value that is determined by local assessors to be the total taxable value of land and additions on the property. | Land | Improvement |
|---|---|---|---|---|
| 2024 | $3,812 | $112,850 | $21,550 | $91,300 |
| 2023 | $4,054 | $102,600 | $21,550 | $81,050 |
| 2022 | $2,992 | $101,600 | $21,550 | $80,050 |
| 2021 | $2,652 | $90,700 | $21,550 | $69,150 |
| 2020 | $2,499 | $90,700 | $21,550 | $69,150 |
| 2019 | $2,374 | $85,350 | $12,800 | $72,550 |
| 2018 | $2,314 | $85,350 | $12,800 | $72,550 |
| 2017 | $2,226 | $82,850 | $12,800 | $70,050 |
| 2016 | $1,961 | $80,450 | $12,800 | $67,650 |
| 2015 | $1,700 | $65,050 | $8,750 | $56,300 |
| 2014 | $1,590 | $59,150 | $8,750 | $50,400 |
| 2013 | $1,602 | $59,150 | $8,750 | $50,400 |
Property History
| Date | Event | Price | List to Sale | Price per Sq Ft |
|---|---|---|---|---|
| 10/16/2025 10/16/25 | Price Changed | $254,900 | -1.9% | $150 / Sq Ft |
| 10/15/2025 10/15/25 | Price Changed | $259,900 | +2.0% | $153 / Sq Ft |
| 10/15/2025 10/15/25 | Price Changed | $254,900 | -1.9% | $150 / Sq Ft |
| 09/23/2025 09/23/25 | Price Changed | $259,900 | -1.9% | $153 / Sq Ft |
| 08/02/2025 08/02/25 | For Sale | $265,000 | -- | $156 / Sq Ft |
Purchase History
| Date | Type | Sale Price | Title Company |
|---|---|---|---|
| Warranty Deed | $143,000 | Title Co |
Mortgage History
| Date | Status | Loan Amount | Loan Type |
|---|---|---|---|
| Open | $140,409 | FHA |
Source: NorthstarMLS
MLS Number: 6765937
APN: 01-1700-00220-000
Disclaimer: Certain information contained herein is derived from information provided by parties other than Homes.com. All information provided is deemed reliable, but is not guaranteed to be accurate and should be independently verified.
![]() Based on information submitted to the MLS GRID. All data is obtained from various sources and may not have been verified by broker or MLS GRID. Supplied Open House Information is subject to change without notice. All information should be independently reviewed and verified for accuracy. Properties may or may not be listed by the office/agent presenting the information. Some IDX listings have been excluded from this website.
Based on information submitted to the MLS GRID. All data is obtained from various sources and may not have been verified by broker or MLS GRID. Supplied Open House Information is subject to change without notice. All information should be independently reviewed and verified for accuracy. Properties may or may not be listed by the office/agent presenting the information. Some IDX listings have been excluded from this website.
The Digital Millennium Copyright Act of 1998, 17 U.S.C. § 512 (the “DMCA”) provides recourse for copyright owners who believe that material appearing on the Internet infringes their rights under U.S. copyright law. If you believe in good faith that any content or material made available in connection with our website or services infringes your copyright, you (or your agent) may send us a notice requesting that the content or material be removed, or access to it blocked.
Notices must be sent in writing by email to DMCAnotice@MLSGrid.com.
The DMCA requires that your notice of alleged copyright infringement include the following information:
(1) description of the copyrighted work that is the subject of claimed infringement;
(2) description of the alleged infringing content and information sufficient to permit us to locate the content;
(3) contact information for you, including your address, telephone number and email address;
(4) a statement by you that you have a good faith belief that the content in the manner complained of is not authorized by the copyright owner, or its agent, or by the operation of any law;
(5) a statement by you, signed under penalty of perjury, that the information in the notification is accurate and that you have the authority to enforce the copyrights that are claimed to be infringed; and
(6) a physical or electronic signature of the copyright owner or a person authorized to act on the copyright owner’s behalf. Failure to include all of the above information may result in the delay of the processing of your complaint.
- 814 19th St S
- 813 17th St S
- 705 20th St S
- 1637 10th Ave S
- 1517 9th Ave S
- 2126 5th Ave S
- 2209 6th Ave S
- 1129 22nd St S Unit B09
- 1129 22nd St S Unit B12
- 1709 13th Ave S
- 2009 13th Ave S
- 2013 13th Ave S
- 2213 5th Ave S
- 1301 16 1 2 St S
- 1529 4th Ave S
- 402 23rd St S
- 1414 10th Ave S
- 1414 6th Ave S
- 1610 2nd Ave S
- 1418 11th Ave S
- 719 21st St S
- 618 23rd St S
- 2211 11th Ave S
- 1129 22nd St S Unit 15
- 129 16th St S Unit 1
- 1341 4th Ave S Unit 2
- 1341 4th Ave S
- 1341 4th Ave S
- 1341 4th Ave S
- 1502-1534 17th St S
- 405-411 University Dr S
- 2542 Villa Dr S
- 101 University Dr S
- 1418 1st Ave N
- 1023 1st Ave S
- 1445 W Gateway Cir S
- 803 7th St S
- 1621 University Dr S
- 1372 32nd St S
- 1001 Northern Pacific Ave N
